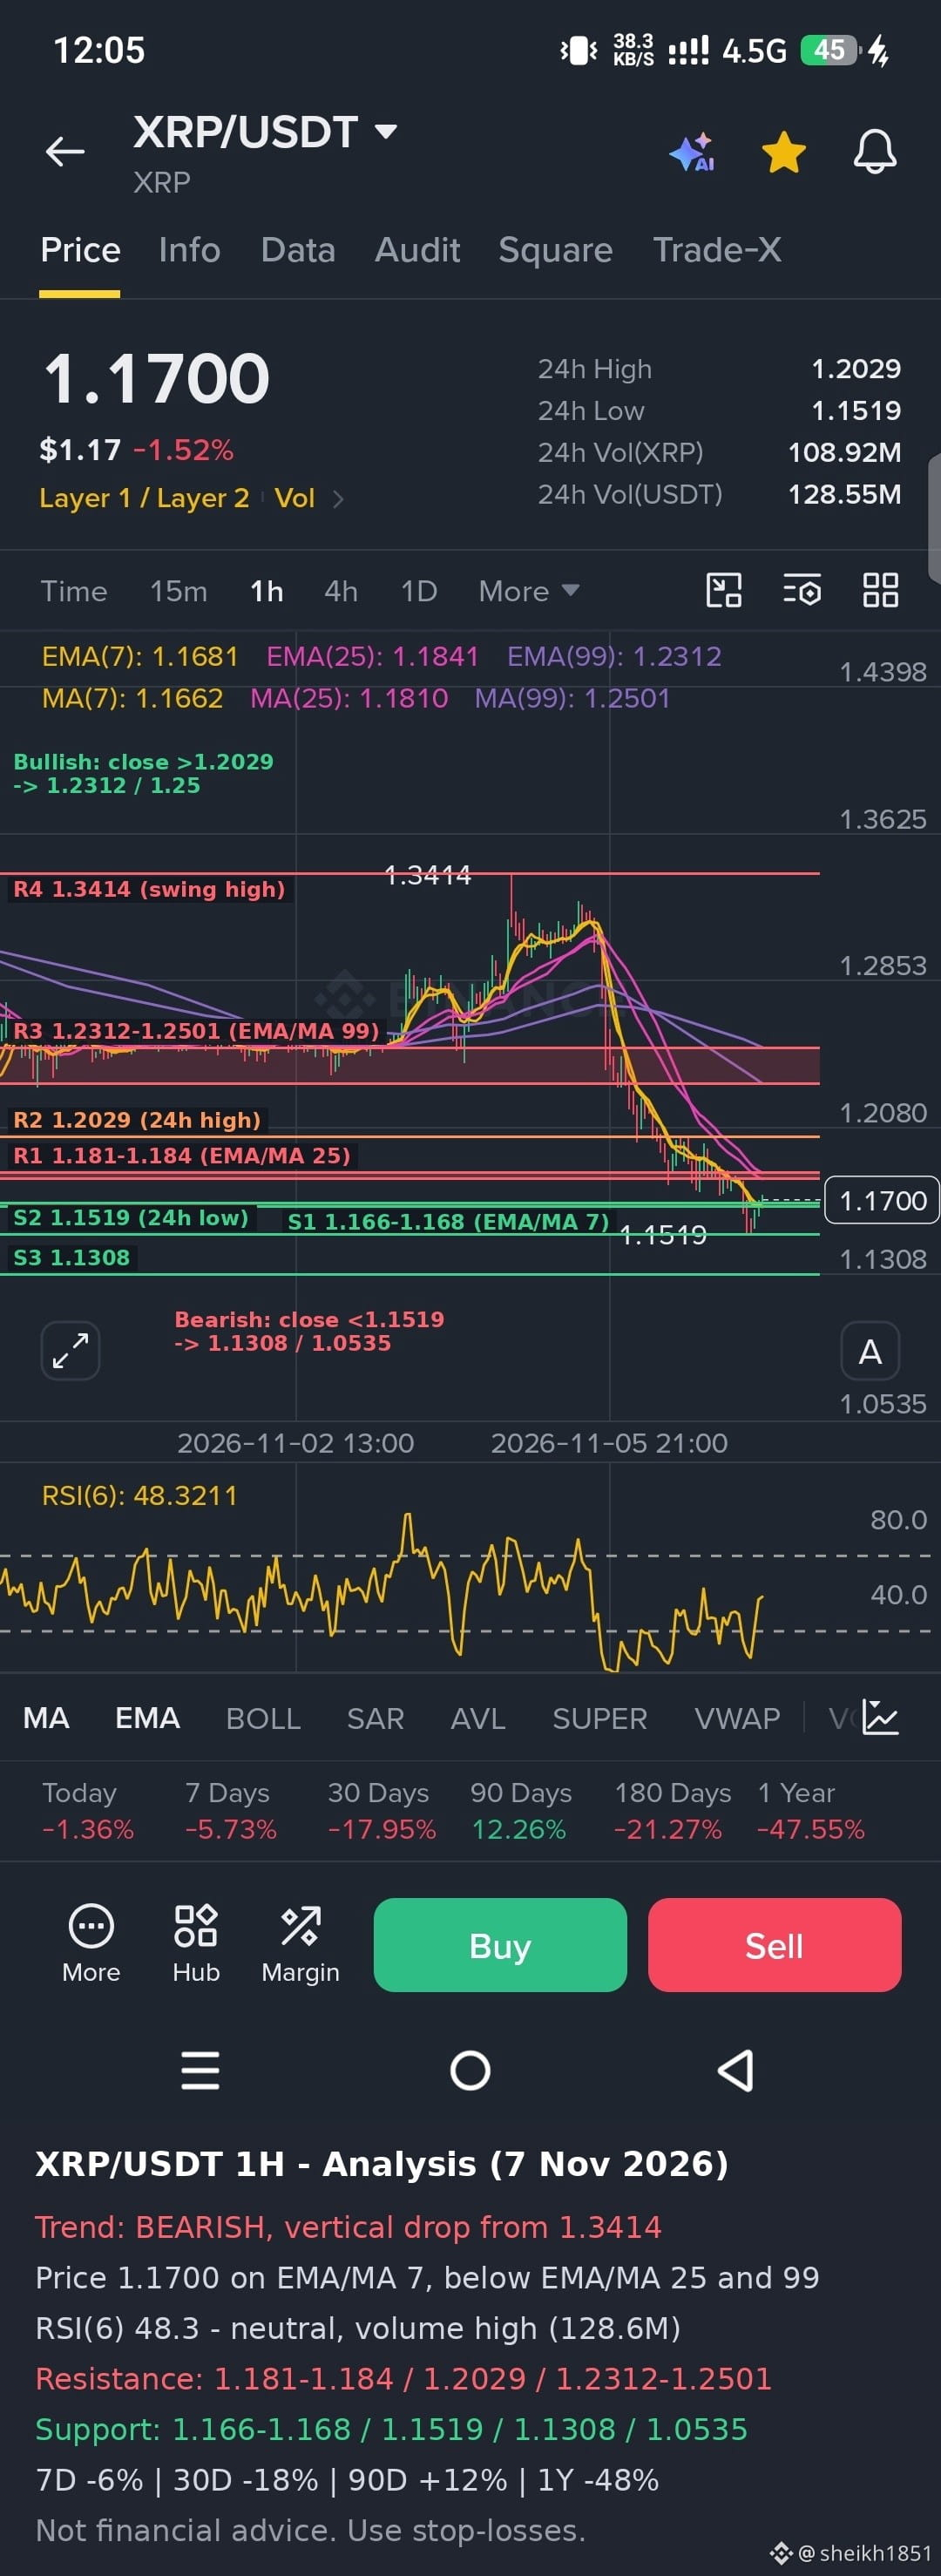
$XRP XRP/USDT (1H) – Quick Analysis
Trend: Bearish. Price (1.1700) fell almost vertically from the 1.3414 swing high to a low of 1.1519 (also the 24h low), and the bounce so far is small. It sits just above EMA(7) 1.1681 and MA(7) 1.1662, but below EMA(25) 1.1841, MA(25) 1.1810, EMA(99) 1.2312 and MA(99) 1.2501, and all of those are sloping down. The longer picture is weak: down about 6% over 7 days, 18% over 30 days and 48% over one year, though up about 12% over 90 days.
Momentum: RSI(6) is about 48.3, which is neutral. It has recovered from oversold, but the move has been mostly sideways, so there is no strong buying pressure yet. Volume is high (about 128.6M USDT), which shows real selling during the drop, not a thin dip.
Key levels:
Resistance: 1.181 to 1.184 (MA/EMA 25), then 1.2029 (24h high), then 1.2312 to 1.2501 (the 99 averages). The 1.3414 swing high is far above.
Support: 1.166 to 1.168 (EMA/MA 7), then 1.1519 (24h low), then 1.1308. Below that, the chart shows 1.0535.
Outlook: The bias stays bearish while price is under 1.184. A relief bounce into 1.181 to 1.184 is the likeliest near-term move, and that area would probably act as resistance. A 1H close below 1.1519 would put 1.1308 in play and could open further downside. A bullish shift needs a 1H close above 1.2029, and the trend would not really turn until price reclaims the 1.23 to 1.25 area.
This is a technical read not financial advice. Use stop-losses and keep position sizes small.#Binance #xrp
Trend: Bearish. Price (1.1700) fell almost vertically from the 1.3414 swing high to a low of 1.1519 (also the 24h low), and the bounce so far is small. It sits just above EMA(7) 1.1681 and MA(7) 1.1662, but below EMA(25) 1.1841, MA(25) 1.1810, EMA(99) 1.2312 and MA(99) 1.2501, and all of those are sloping down. The longer picture is weak: down about 6% over 7 days, 18% over 30 days and 48% over one year, though up about 12% over 90 days.
Momentum: RSI(6) is about 48.3, which is neutral. It has recovered from oversold, but the move has been mostly sideways, so there is no strong buying pressure yet. Volume is high (about 128.6M USDT), which shows real selling during the drop, not a thin dip.
Key levels:
Resistance: 1.181 to 1.184 (MA/EMA 25), then 1.2029 (24h high), then 1.2312 to 1.2501 (the 99 averages). The 1.3414 swing high is far above.
Support: 1.166 to 1.168 (EMA/MA 7), then 1.1519 (24h low), then 1.1308. Below that, the chart shows 1.0535.
Outlook: The bias stays bearish while price is under 1.184. A relief bounce into 1.181 to 1.184 is the likeliest near-term move, and that area would probably act as resistance. A 1H close below 1.1519 would put 1.1308 in play and could open further downside. A bullish shift needs a 1H close above 1.2029, and the trend would not really turn until price reclaims the 1.23 to 1.25 area.
This is a technical read not financial advice. Use stop-losses and keep position sizes small.#Binance #xrp