
$PEPE
PEPE/USDT on the 1h chart caught my eye because the volume has dried up almost completely while price sits in the middle of a wide range.
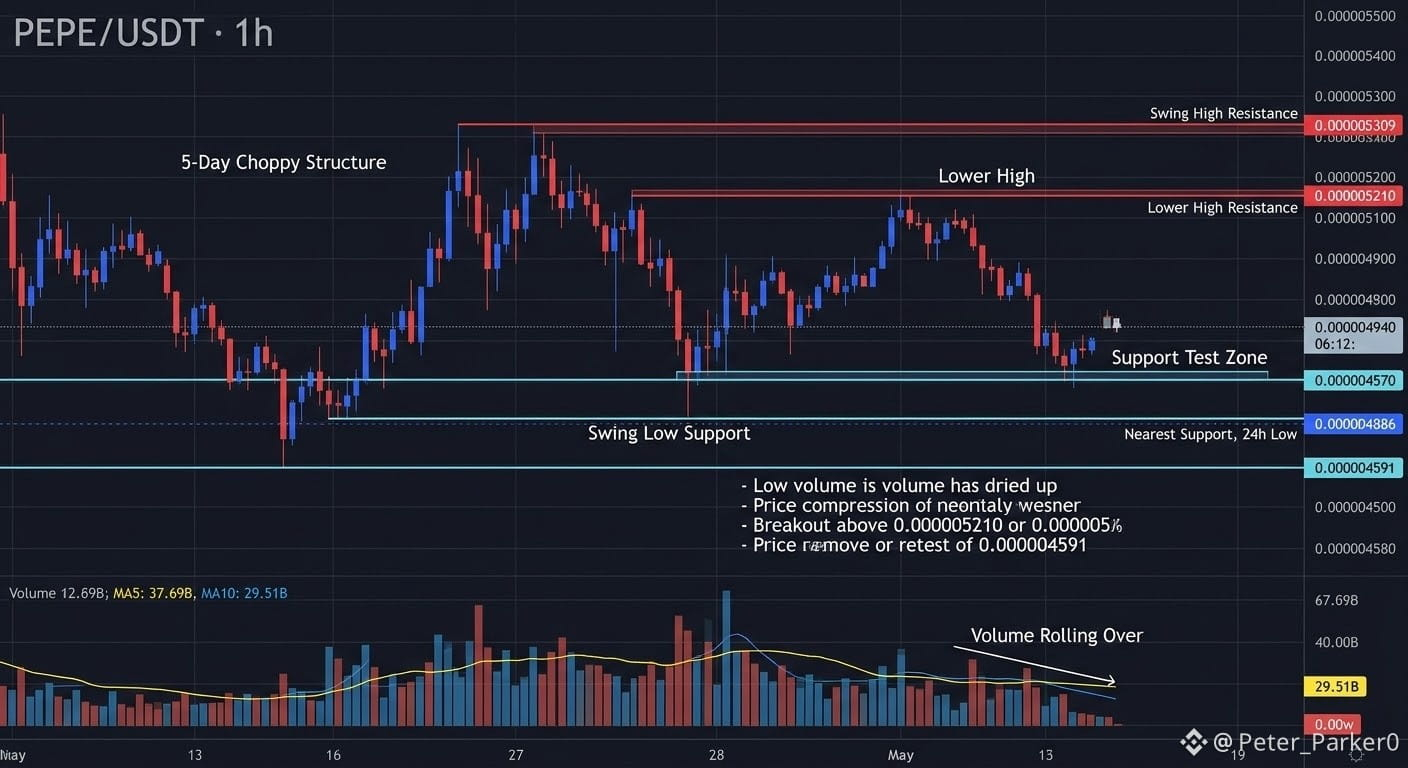
Zooming out, the five-day structure has been choppy. Price dropped to a swing low at 0.000004591, bounced hard to a high at 0.000005309, then pulled back, made a lower high near 0.000005210, and is now trading around 0.000004940, down roughly 3% on the day. That lower high matters. Buyers are still defending dips, but they are no longer pushing to new highs.
On the indicators, the volume moving averages (MA5 around 37.69B, MA10 around 29.51B) are both rolling over, and current volume is thin. That suggests compression and indecision rather than conviction. The 24h low at 0.000004886 is the nearest support, while 0.000005210 is the nearest resistance. Price is sandwiched between them, so neither bulls nor bears have control. None of this guarantees a direction.
This is where FOMO usually costs people money. One green candle on low volume can easily be a bounce inside a range, and buying it means paying a worse price with no confirmation behind it.
On the setup, I haven't defined a firm entry, stop-loss, or targets here, and I won't invent them. Without a set entry and stop, a risk-to-reward ratio can't be calculated honestly. I'd only build one once price reacts at the levels above.
For confirmation, I want to see a 1h close above 0.000005210 with volume expanding, which would break the lower-high structure. A clean loss of 0.000004886 would invalidate any bullish idea and put the 0.000004591 low back in play.
This is an uncertain setup. Protect capital first, size small, and accept that sitting out is a valid trade.
Do you see this as accumulation inside the range, or a slow bleed toward the 0.000004591 low?
#JobsReportRaisesHikeOdds
#CPITestsDecemberRateOutlook #WillAnthropicListOnTime #HKSFCPlansToRestrictCryptoAndExchangeTerms #TradFiForBeginners
PEPE/USDT on the 1h chart caught my eye because the volume has dried up almost completely while price sits in the middle of a wide range.
Zooming out, the five-day structure has been choppy. Price dropped to a swing low at 0.000004591, bounced hard to a high at 0.000005309, then pulled back, made a lower high near 0.000005210, and is now trading around 0.000004940, down roughly 3% on the day. That lower high matters. Buyers are still defending dips, but they are no longer pushing to new highs.
On the indicators, the volume moving averages (MA5 around 37.69B, MA10 around 29.51B) are both rolling over, and current volume is thin. That suggests compression and indecision rather than conviction. The 24h low at 0.000004886 is the nearest support, while 0.000005210 is the nearest resistance. Price is sandwiched between them, so neither bulls nor bears have control. None of this guarantees a direction.
This is where FOMO usually costs people money. One green candle on low volume can easily be a bounce inside a range, and buying it means paying a worse price with no confirmation behind it.
On the setup, I haven't defined a firm entry, stop-loss, or targets here, and I won't invent them. Without a set entry and stop, a risk-to-reward ratio can't be calculated honestly. I'd only build one once price reacts at the levels above.
For confirmation, I want to see a 1h close above 0.000005210 with volume expanding, which would break the lower-high structure. A clean loss of 0.000004886 would invalidate any bullish idea and put the 0.000004591 low back in play.
This is an uncertain setup. Protect capital first, size small, and accept that sitting out is a valid trade.
Do you see this as accumulation inside the range, or a slow bleed toward the 0.000004591 low?
#JobsReportRaisesHikeOdds
#CPITestsDecemberRateOutlook #WillAnthropicListOnTime #HKSFCPlansToRestrictCryptoAndExchangeTerms #TradFiForBeginners