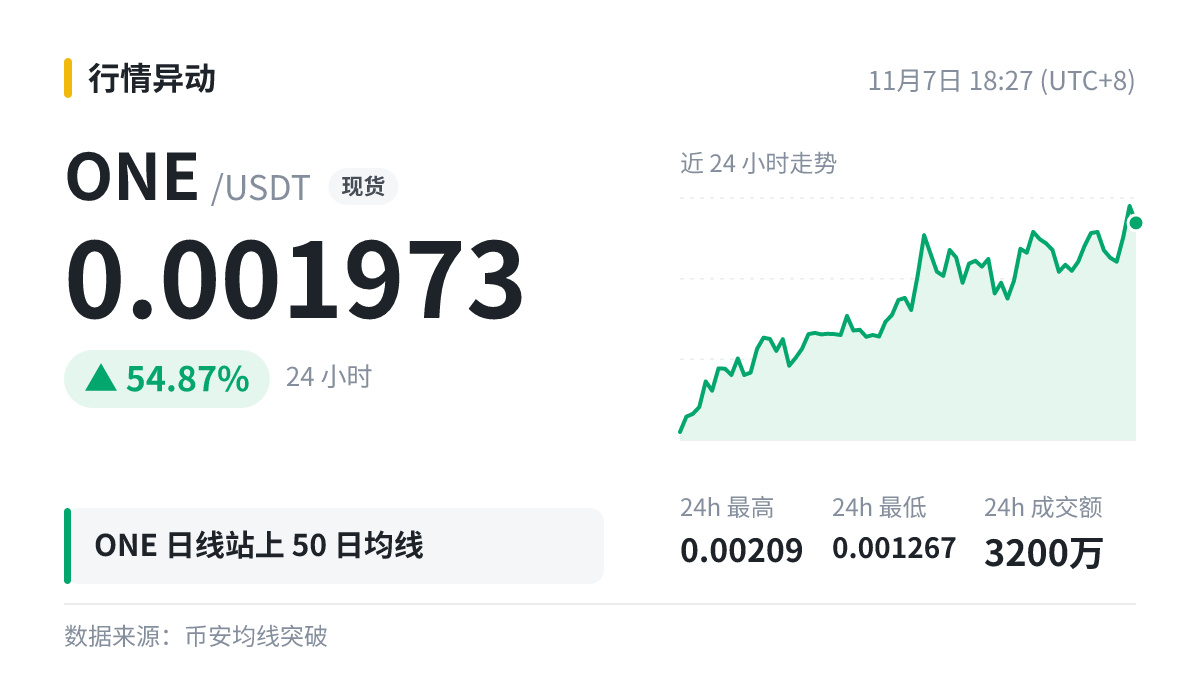
$ONE |Daily close above MA50|MA50 0.001921
Before discussing capital, understand moving averages first.
On the daily chart, MA200 is the average closing price over the most recent 200 days and is often used as a reference line for the long-term trend; MA50 is commonly used to observe the medium-term direction.
When the price is far from the long-term moving average, it is often seen as tending to revert toward the average, but during a strong trend, this divergence can also persist for a long time.
Don’t change your original plan based on a single indicator, and don’t use borrowed money to test a prediction.
Before discussing capital, understand moving averages first.
On the daily chart, MA200 is the average closing price over the most recent 200 days and is often used as a reference line for the long-term trend; MA50 is commonly used to observe the medium-term direction.
When the price is far from the long-term moving average, it is often seen as tending to revert toward the average, but during a strong trend, this divergence can also persist for a long time.
Don’t change your original plan based on a single indicator, and don’t use borrowed money to test a prediction.