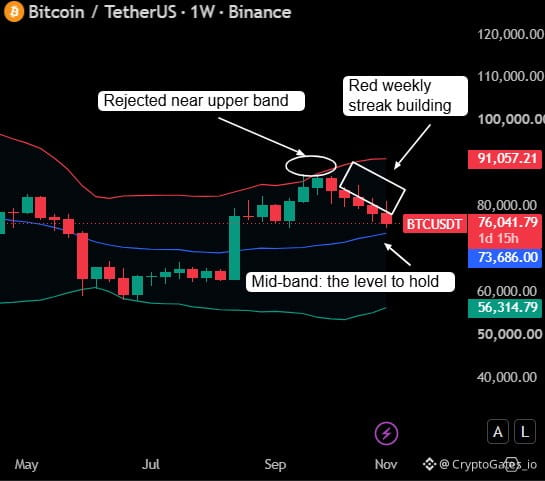
$BTC weekly: red streak building, price at the mid-band 📉
BTC is trading near 76,042 on the 1W chart, down roughly 3% on the current open candle. Price was rejected near the upper Bollinger band (about 91k) and has stepped lower since, now pressing on the mid-band at 73,686.
How I’d frame it:
Mid-band holds and the week closes stable: momentum from sellers likely fades, chop continues
Weekly close below the mid-band: the lower band near 56k becomes the next reference zone
A bounce alone is not a confirmed reversal
Streaks are context, not signals. Define your levels and your risk before the weekly close, not after.
Verify first. Risk later. Scale slowly.
#BTC #Bitcoin #BinanceSquare
BTC is trading near 76,042 on the 1W chart, down roughly 3% on the current open candle. Price was rejected near the upper Bollinger band (about 91k) and has stepped lower since, now pressing on the mid-band at 73,686.
How I’d frame it:
Mid-band holds and the week closes stable: momentum from sellers likely fades, chop continues
Weekly close below the mid-band: the lower band near 56k becomes the next reference zone
A bounce alone is not a confirmed reversal
Streaks are context, not signals. Define your levels and your risk before the weekly close, not after.
Verify first. Risk later. Scale slowly.
#BTC #Bitcoin #BinanceSquare