BTC at $76,200—would you still dare to buy the dip?
ETF outflows hit $1.28 billion in a week, nonfarm payrolls blew past expectations, and over $1 billion in long positions got wiped out—75k just held. Is this the final drop, or just an appetizer for the bear market?
First, the surface picture: BTC is ranging between 75k and 76.5k. Does it look stable?
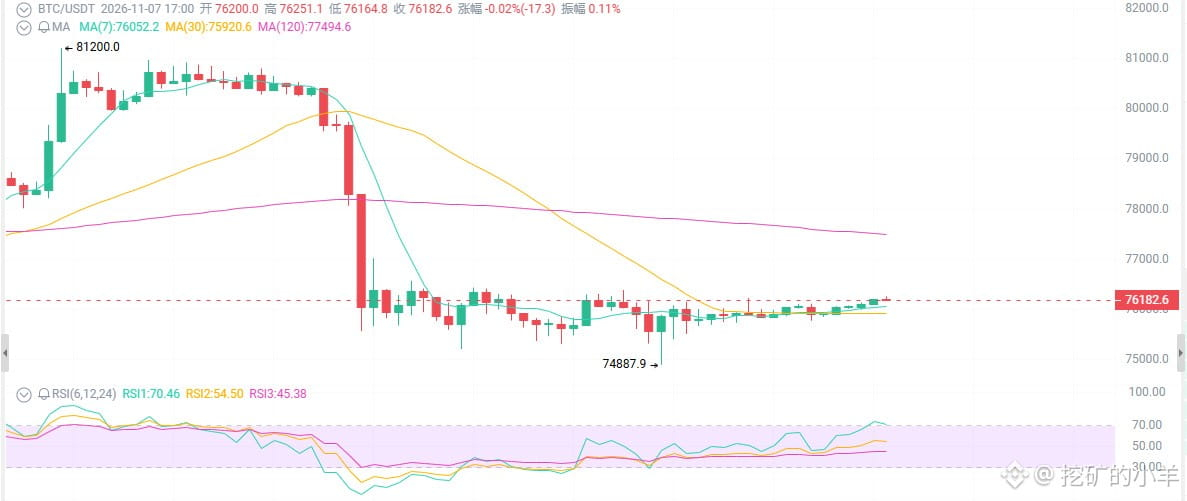
Volatility has narrowed over the past 24 hours. With low weekend liquidity, the price has been moving sideways between 75,000 and 76,500. You open the chart, see 75k holding, and wonder: is it stable now?
After a rapid retreat from 81,000 over the past week, BTC fell 5–6% in a single day on November 5, liquidating more than $1 billion in leveraged long positions. Now buyers and sellers alike are waiting for next week’s CPI data and the December FOMC meeting. Whoever moves first could be the first to get it wrong.
First thing: ETFs are seeing outflows—and big money is behind them.
In November, spot BTC ETFs saw cumulative outflows of about $1.28 billion, including roughly $412 million on Friday alone. BlackRock IBIT was the main driver.
This isn’t retail panic; institutions are cutting their positions.
ETF outflows aren’t noise. Pricing power is shifting from those chasing the rally to those waiting for a dip.
But note: outflows are slowing, the fear index is cooling, and selling pressure is easing.
Second thing: nonfarm payrolls blew past expectations, crushing hopes for rate cuts.
October nonfarm payrolls rose by 165,000, against expectations of just 59,000–65,000; unemployment was 4.1%, and wage growth remained sticky. The probability of a December rate hike briefly surged to 70–80%. The federal funds rate is 3.75–4.00%, while PCE/CPI inflation is still at 3.6–3.7%.
Real interest rates are high, and BTC is a non-yielding asset. The macro backdrop is a headwind.
Strong payrolls aren’t good news for BTC; they tighten the screws on risk assets another turn.
But consider the flip side: if CPI cools in mid-November, or the Fed makes even one dovish remark, a reversal could come quickly.
Third thing: 75k is a cost-basis zone for long-term holders, but don’t mistake it for an ironclad floor.
After the long, high-volume bearish candle on November 5, prices found some stability around 75,000–76,000, which is also a cost-basis cluster for long-term holders. At 76,200, BTC is in the upper-middle part of the range, with volume thinning over the weekend.
The daily chart has broken below the 20- and 50-day moving averages, forming lower highs and lower lows. RSI has bounced from oversold territory but remains neutral-to-low; the MACD histogram is contracting after a bearish cross; and the 4-hour chart is trying to form a base, but has yet to break above the downtrend line.
Support: 75,000–74,500; if that gives way, watch 73,000–70,000.
Resistance: 77,000–78,000, then the 80,000–81,000 gap, with strong resistance at 82,000–84,000.
75k holding isn’t a victory—the referee just hasn’t blown the whistle. If BTC can’t reclaim 77–78k, every bounce is just a recovery, not a reversal.
ETF outflows hit $1.28 billion in a week, nonfarm payrolls blew past expectations, and over $1 billion in long positions got wiped out—75k just held. Is this the final drop, or just an appetizer for the bear market?
First, the surface picture: BTC is ranging between 75k and 76.5k. Does it look stable?
Volatility has narrowed over the past 24 hours. With low weekend liquidity, the price has been moving sideways between 75,000 and 76,500. You open the chart, see 75k holding, and wonder: is it stable now?
After a rapid retreat from 81,000 over the past week, BTC fell 5–6% in a single day on November 5, liquidating more than $1 billion in leveraged long positions. Now buyers and sellers alike are waiting for next week’s CPI data and the December FOMC meeting. Whoever moves first could be the first to get it wrong.
First thing: ETFs are seeing outflows—and big money is behind them.
In November, spot BTC ETFs saw cumulative outflows of about $1.28 billion, including roughly $412 million on Friday alone. BlackRock IBIT was the main driver.
This isn’t retail panic; institutions are cutting their positions.
ETF outflows aren’t noise. Pricing power is shifting from those chasing the rally to those waiting for a dip.
But note: outflows are slowing, the fear index is cooling, and selling pressure is easing.
Second thing: nonfarm payrolls blew past expectations, crushing hopes for rate cuts.
October nonfarm payrolls rose by 165,000, against expectations of just 59,000–65,000; unemployment was 4.1%, and wage growth remained sticky. The probability of a December rate hike briefly surged to 70–80%. The federal funds rate is 3.75–4.00%, while PCE/CPI inflation is still at 3.6–3.7%.
Real interest rates are high, and BTC is a non-yielding asset. The macro backdrop is a headwind.
Strong payrolls aren’t good news for BTC; they tighten the screws on risk assets another turn.
But consider the flip side: if CPI cools in mid-November, or the Fed makes even one dovish remark, a reversal could come quickly.
Third thing: 75k is a cost-basis zone for long-term holders, but don’t mistake it for an ironclad floor.
After the long, high-volume bearish candle on November 5, prices found some stability around 75,000–76,000, which is also a cost-basis cluster for long-term holders. At 76,200, BTC is in the upper-middle part of the range, with volume thinning over the weekend.
The daily chart has broken below the 20- and 50-day moving averages, forming lower highs and lower lows. RSI has bounced from oversold territory but remains neutral-to-low; the MACD histogram is contracting after a bearish cross; and the 4-hour chart is trying to form a base, but has yet to break above the downtrend line.
Support: 75,000–74,500; if that gives way, watch 73,000–70,000.
Resistance: 77,000–78,000, then the 80,000–81,000 gap, with strong resistance at 82,000–84,000.
75k holding isn’t a victory—the referee just hasn’t blown the whistle. If BTC can’t reclaim 77–78k, every bounce is just a recovery, not a reversal.