$ETH This chart can be summed up in one sentence: the rally failed, and price is back where it started.
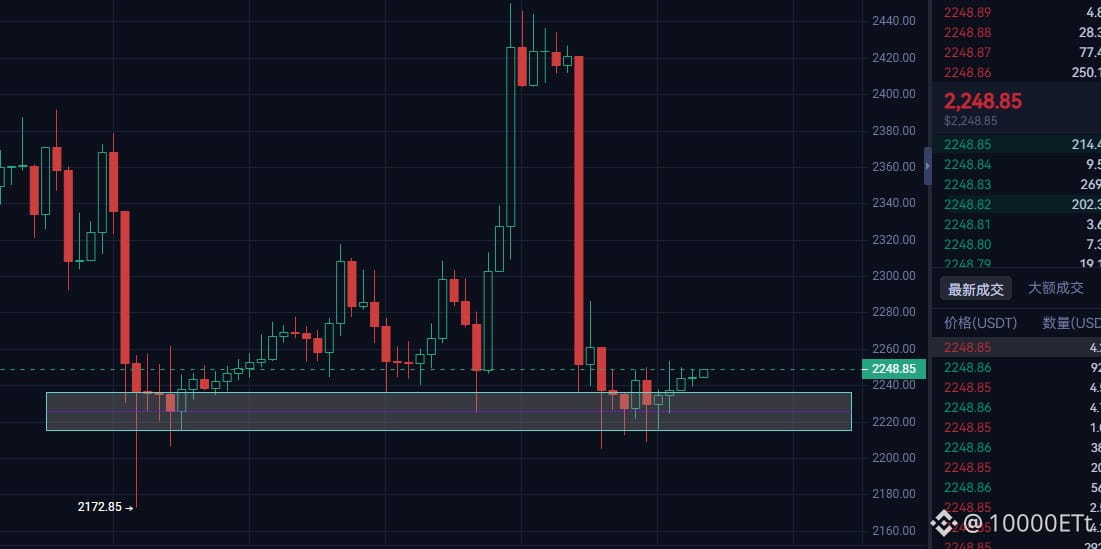
Price is now around 2248. It already tested 2430 above but couldn't hold, and a large bearish candle sent it straight back down. Now it's stuck at the top of the 2200–2240 support range. The long lower wick at 2172 marks the recent low.
The structure is still sideways, not strong. The highs are getting lower, and volume hasn't picked up either. The last thing you want to do here is chase a bounce.
My take: first, watch whether price can close above 2250. If it does, 2300 could be in reach. The real dividing line is 2430—only a sustained hold above it would signal a stronger trend. Below, a break of 2240 would bring 2200 back into play. If 2172 breaks, that's the last line of defense!
#CPI前瞻,12月利率走向迎关键考验 #非农就业数据推升加息预期
Price is now around 2248. It already tested 2430 above but couldn't hold, and a large bearish candle sent it straight back down. Now it's stuck at the top of the 2200–2240 support range. The long lower wick at 2172 marks the recent low.
The structure is still sideways, not strong. The highs are getting lower, and volume hasn't picked up either. The last thing you want to do here is chase a bounce.
My take: first, watch whether price can close above 2250. If it does, 2300 could be in reach. The real dividing line is 2430—only a sustained hold above it would signal a stronger trend. Below, a break of 2240 would bring 2200 back into play. If 2172 breaks, that's the last line of defense!
#CPI前瞻,12月利率走向迎关键考验 #非农就业数据推升加息预期