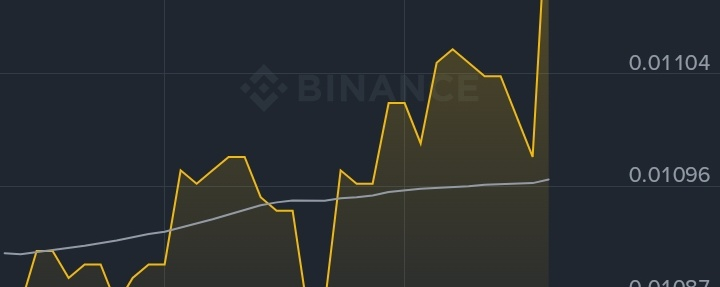

Traders analyze the market beyond surface-level changes. Here’s a detailed examination of ACT's recent performance. - $0.00935 Low to $0.01138 High - $0.01119 - Trading just below 24h High - 356.73M ACT / $3.68M USDT - Notable for a low-cap asset - $0.01096 - Price is above this moving average, indicating short-term bullish sentiment Today: 7 Days: - Indicates strong momentum 30 Days: 90 Days: 180 Days: 1 Year: While ACT has shown significant short-term gains, it remains down 35% over the past year, suggesting that it is undergoing a recovery rather than establishing a new upward trend. In the 15-minute chart: - ACT was consolidating between $0.0108 and $0.0110 for several hours, forming higher lows. - A significant upward movement occurred with a large volume spike (1.26M ACT in one candle compared to an average of 10.4K), indicative of substantial market interest. - The price broke above the MA60 and remained above it, suggesting a standard breakout and retest scenario. Price movements accompanied by a volume increase indicate a genuine trend. Conversely, price increases without volume may suggest potential traps. In this case, the volume indicates a real move. $0.01096 (MA60) - Holding here suggests bullish control $0.01040 - A drop below this level would indicate a false breakout $0.00935 - The 24h Low - This level should not be breached $0.01138 (24h High) - A break above could lead to a target of $0.01250 $0.01250 to $0.01300 - A major supply zone $0.01400 - Potential resistance from sellers over the past 180 days ACT is associated with the AI narrative, which is revitalizing interest in the sector. A 39% increase over the last week indicates accumulation. If BTC holds steady and ACT closes above $0.01138 today, a target of $0.013+ could be viable. ACT is categorized as a "Monitoring" coin on Binance, which implies high volatility. Rapid price increases can be followed by swift declines. The long-term downward trend of one year has not been broken. It is advisable not to chase price increases without a proper strategy and to wait for a retest of $0.01096. - If already invested, consider taking 30-40% profit at $0.01138 and maintain the remaining position with a stop-loss at $0.01040. - For those not yet invested, avoid impulsive buying. Wait for a pullback to the $0.0110 to $0.01096 zone. If this level holds, consider entering with a smaller position. - For futures traders: Be cautious with leverage; this asset can move 14% within minutes. In conclusion, ACT has shown short-term bullishness, but the long-term trend remains in recovery. Monitor the momentum and respect the outlined levels. Are you holding ACT or waiting for a dip? Comment or This is not financial advice. Conduct your own research and always use stop-loss orders.
