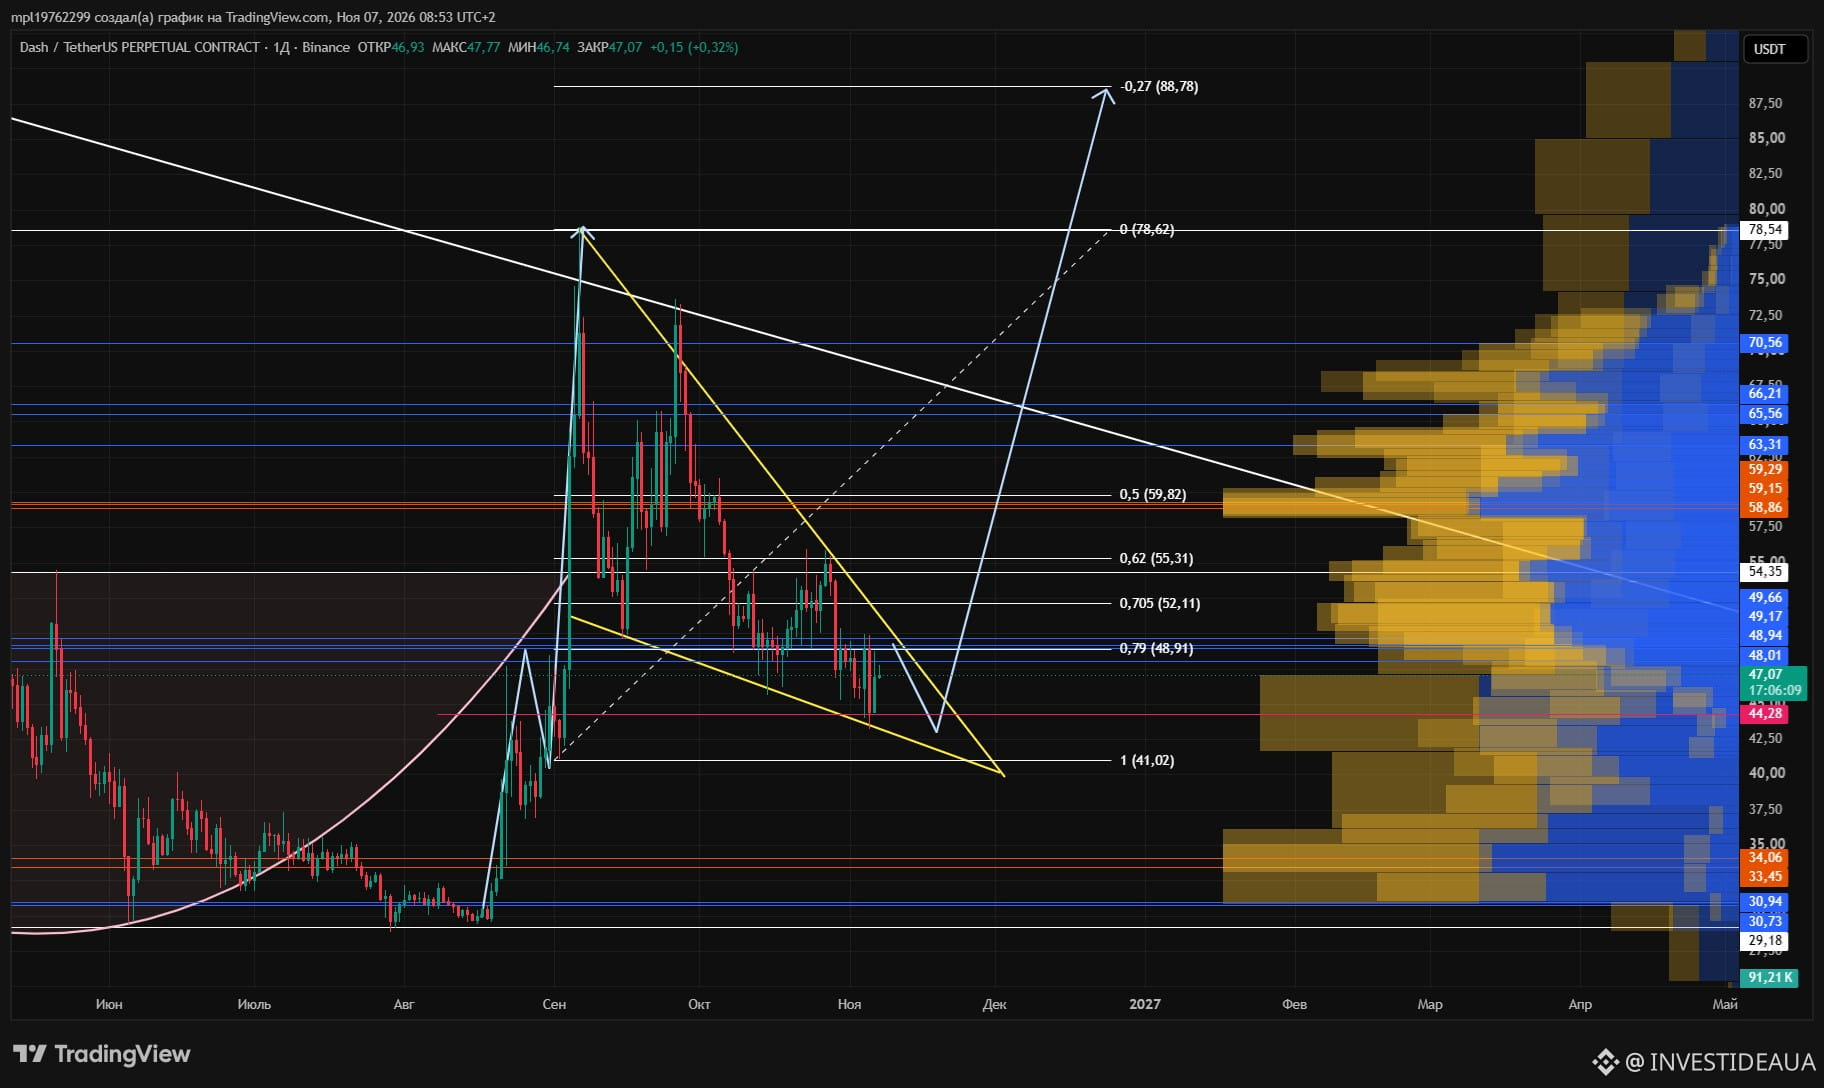
movement forecast $DASH
07/11
My updated forecast after studying your charts:
In the short term, I expect a correction to 46.54–45.65 first, followed by an attempt to resume the rise toward 48.72.
Why:
• A local bullish BOS has formed on the 2H chart.
• The market reacted to the lower boundary of the descending wedge.
• The current pullback has not yet invalidated the established upward impulse.
• There are clusters of sell-side liquidity in the 45.8–46.3 area.
• A potential reversal pattern is present on the daily chart.
But the upper range of 48.72–49.97 remains a serious obstacle.
Three testable outcomes
Scenario 1 — correction and rise
A correction to 46.02–45.65, holding that level, then a return to 48.72. After a breakout and consolidation above 49.97, the potential targets are 51.41 and 53.07.
This is my preferred hypothesis for testing a local LONG.
Scenario 2 — the recovery turned out to be a correction
The price fails to hold 46.02–45.65 and returns to 44.37 and 43.21.
A break below 43.21 will significantly weaken your bullish reversal hypothesis.
Scenario 3 — further consolidation
The price holds between approximately 45.65 and 48.72. No new sustained direction emerges. Repeated tests of both boundaries are possible.
07/11
My updated forecast after studying your charts:
In the short term, I expect a correction to 46.54–45.65 first, followed by an attempt to resume the rise toward 48.72.
Why:
• A local bullish BOS has formed on the 2H chart.
• The market reacted to the lower boundary of the descending wedge.
• The current pullback has not yet invalidated the established upward impulse.
• There are clusters of sell-side liquidity in the 45.8–46.3 area.
• A potential reversal pattern is present on the daily chart.
But the upper range of 48.72–49.97 remains a serious obstacle.
Three testable outcomes
Scenario 1 — correction and rise
A correction to 46.02–45.65, holding that level, then a return to 48.72. After a breakout and consolidation above 49.97, the potential targets are 51.41 and 53.07.
This is my preferred hypothesis for testing a local LONG.
Scenario 2 — the recovery turned out to be a correction
The price fails to hold 46.02–45.65 and returns to 44.37 and 43.21.
A break below 43.21 will significantly weaken your bullish reversal hypothesis.
Scenario 3 — further consolidation
The price holds between approximately 45.65 and 48.72. No new sustained direction emerges. Repeated tests of both boundaries are possible.