$ACT This chart is a classic “short squeeze on heavy volume”—anyone shorting it has nerves of steel.
Look at the price-volume relationship: massive volume came in at the daily-chart bottom, driving a big bullish candle straight through several moving averages. That’s a clear sign of major players putting real money to work. The breakout above the moving averages on the 4-hour chart also came with sustained heavy volume, showing extremely strong buying pressure.
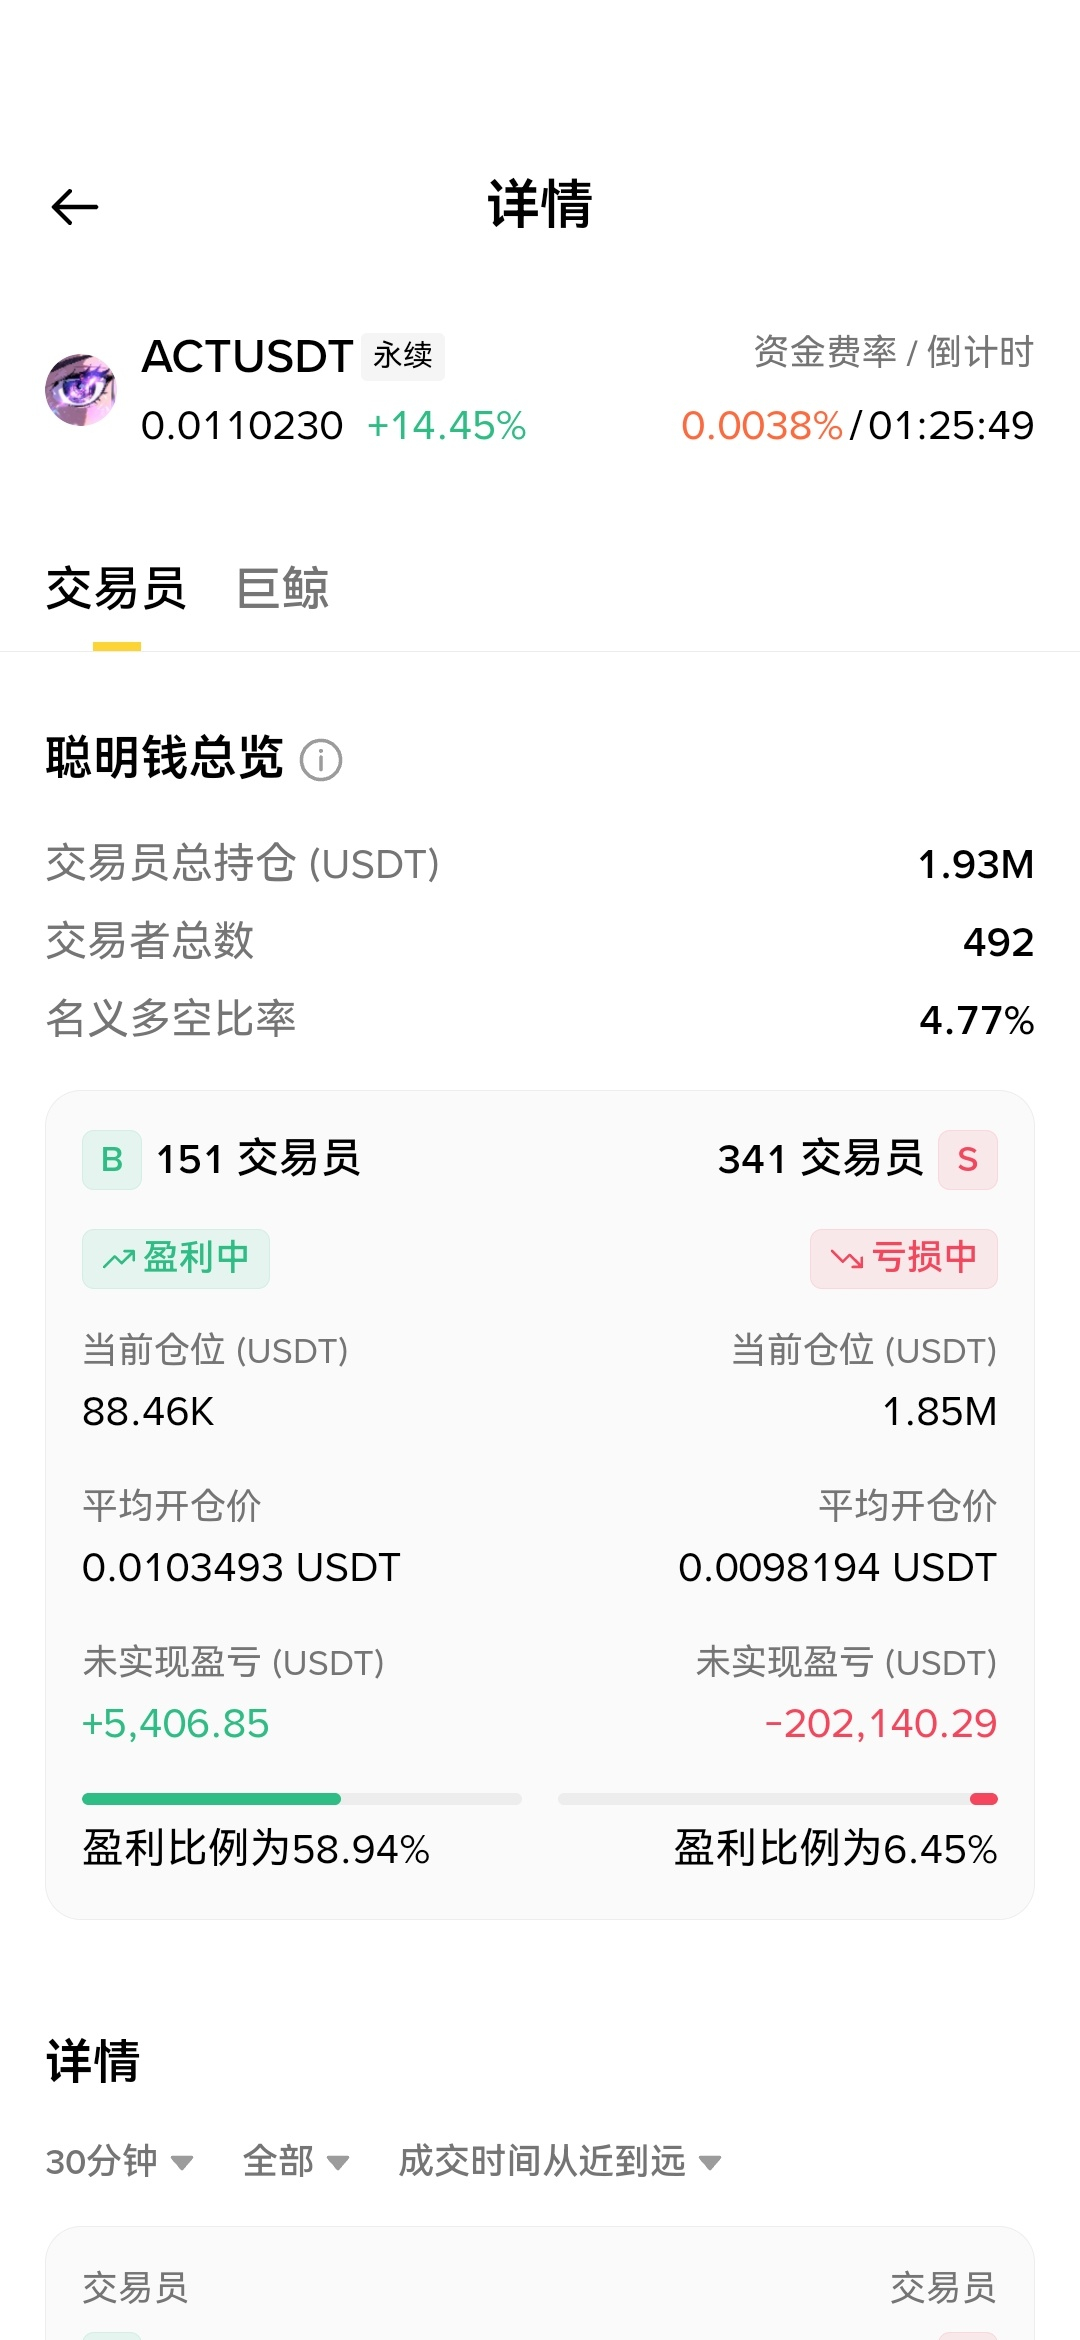
Now look at the data: the long/short ratio is only 4.77%! 341 short sellers poured in nearly 2 million USDT and ended up trapped, down 200,000 USDT. Those few million USDT in short positions are perfect fuel for the next leg up.
As for trading: don’t chase the price—wait for a pullback to go long!
Wait for a pullback to 0.0100–0.0102, then enter long. Set your stop at 0.0095. Aim straight for the previous high at 0.014—let’s liquidate all these shorts! $ACT
Look at the price-volume relationship: massive volume came in at the daily-chart bottom, driving a big bullish candle straight through several moving averages. That’s a clear sign of major players putting real money to work. The breakout above the moving averages on the 4-hour chart also came with sustained heavy volume, showing extremely strong buying pressure.
Now look at the data: the long/short ratio is only 4.77%! 341 short sellers poured in nearly 2 million USDT and ended up trapped, down 200,000 USDT. Those few million USDT in short positions are perfect fuel for the next leg up.
As for trading: don’t chase the price—wait for a pullback to go long!
Wait for a pullback to 0.0100–0.0102, then enter long. Set your stop at 0.0095. Aim straight for the previous high at 0.014—let’s liquidate all these shorts! $ACT