

First image: Japanese candlesticks – reading the primary trend (Trend Reading)
This example focuses on how to use Japanese candlesticks to identify the market's overall trend (uptrend, downtrend, or sideways) by observing the sequence of candle highs and lows and the predominant colors.
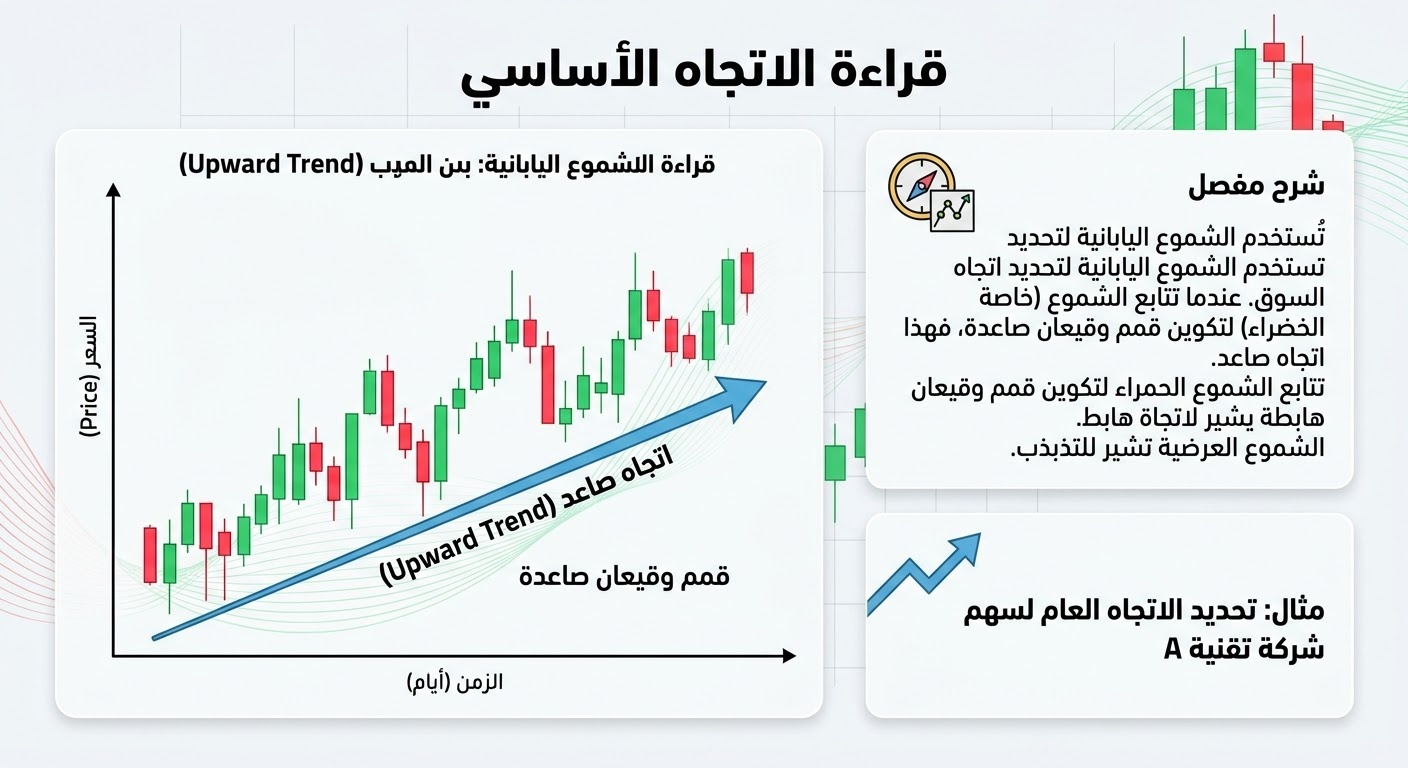
First image description (reading the primary trend):
Concept: The chart shows a sequence of green and red candles. An upward-pointing blue arrow shows how "higher highs and higher lows" indicate an uptrend.
Detailed explanation (in the image): The text explains that the sequence of candlesticks determines the trend. Consecutive green candles with rising highs and lows indicate an uptrend, and the opposite is true for red candles. Sideways movement indicates indecision.
Practical example: Identifying the overall trend of stock in technology company A.
Second image: Japanese candlesticks - Support & Resistance levels
In this example, a Japanese candlestick chart is used to identify price levels that prices have difficulty moving above (resistance) or falling below (support), based on how the candlesticks react at those levels.
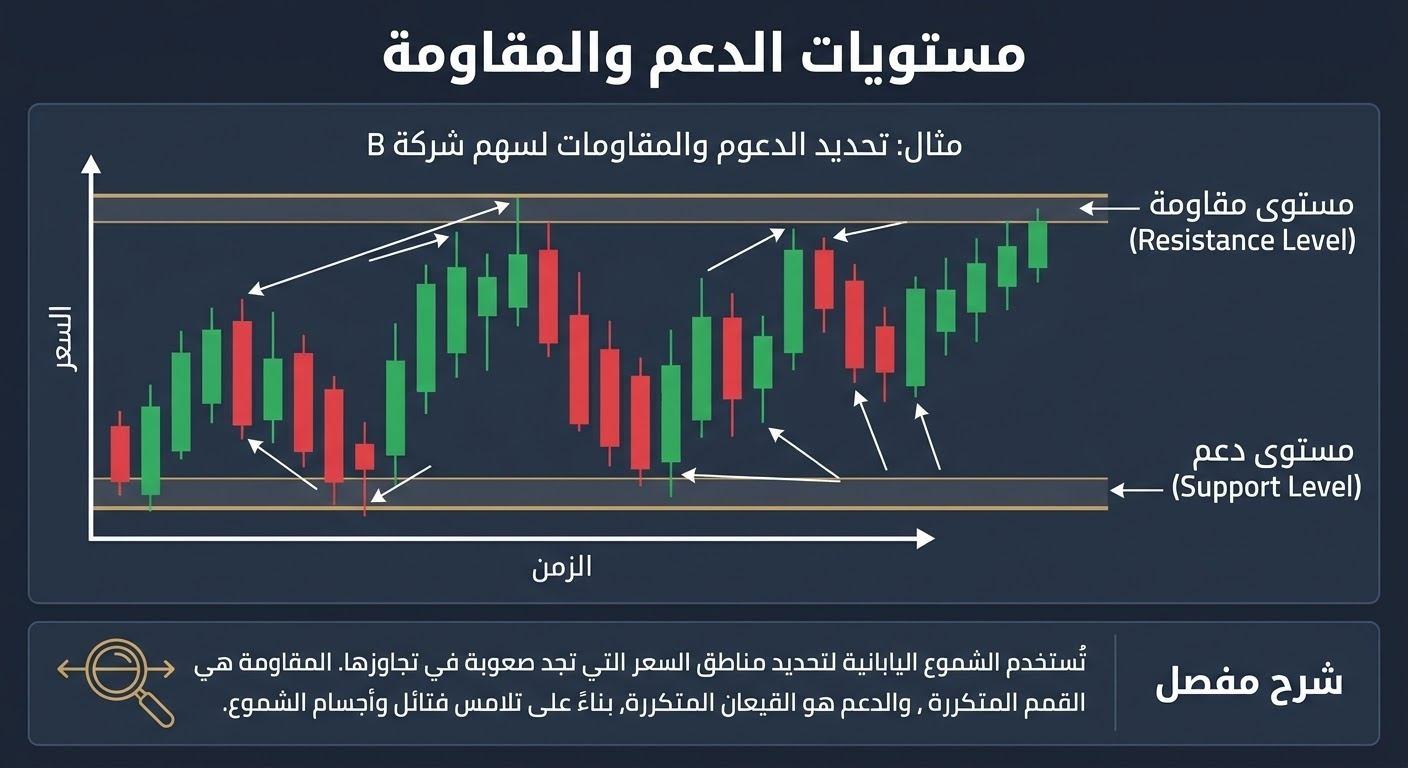
Explanation of the second image (Support and Resistance levels):
Concept: The candlestick chart shows strong horizontal lines. The upper line represents a "resistance level," and the lower line represents a "support level." The arrows point to places where the wicks and bodies of the candlesticks touched these lines.
Details: The detailed explanation clarifies that resistance is formed by repeated highs, while support is formed by repeated lows.
Practical example: Identifying support and resistance levels for stock in company B.
Third image: Japanese candlesticks - Volume Analysis with Candlesticks
In this example, the Japanese candlestick chart is paired with a volume indicator, and the strength or weakness of price movement is analyzed based on the trading volume accompanying those candlesticks
.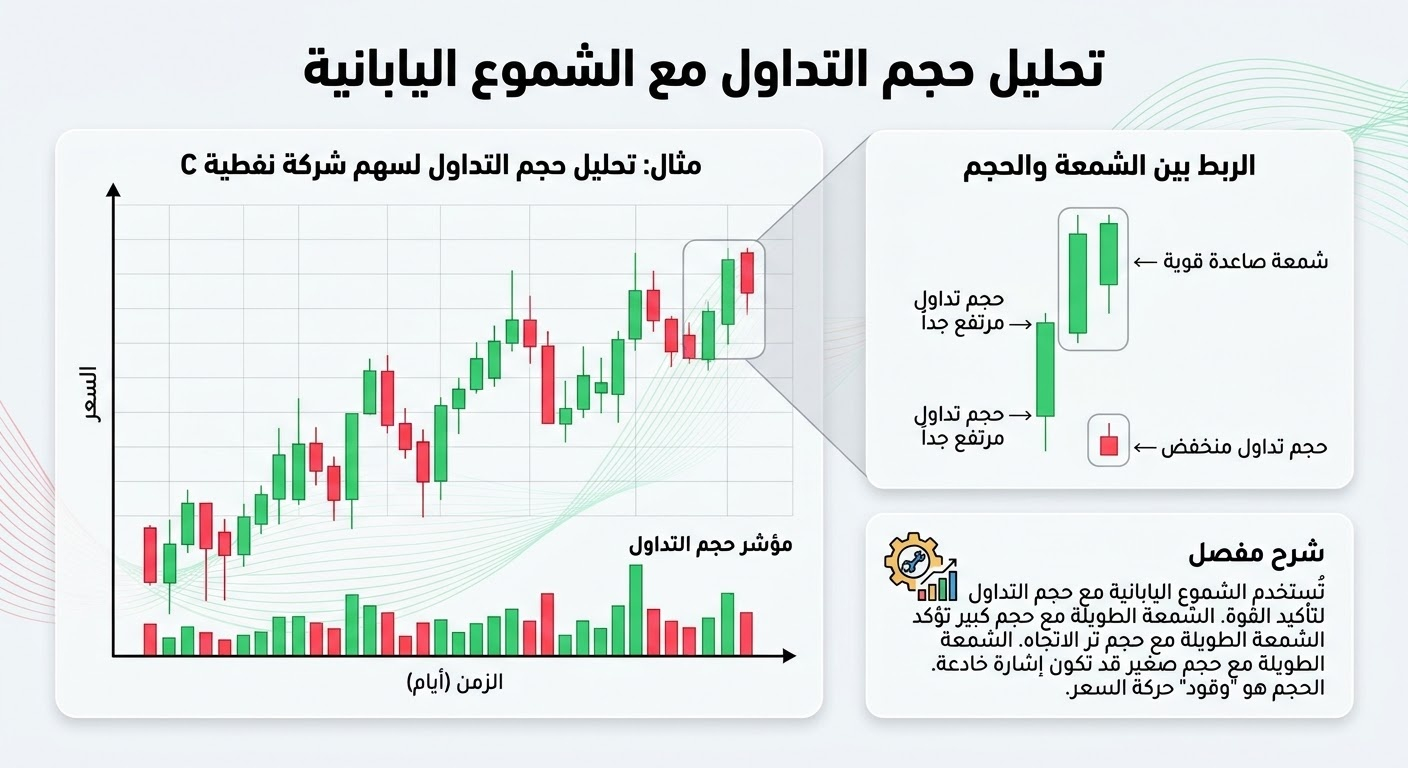
Explanation of the third image (Volume analysis with candlesticks):
Concept: The candlestick chart is supplemented by volume bars at the bottom. The zoomed-in view shows a long green candle with a very high volume bar, confirming strength.
Details: The detailed explanation describes volume as the "fuel" behind a movement. A long candle accompanied by high volume confirms the trend, while low volume may be a misleading signal.
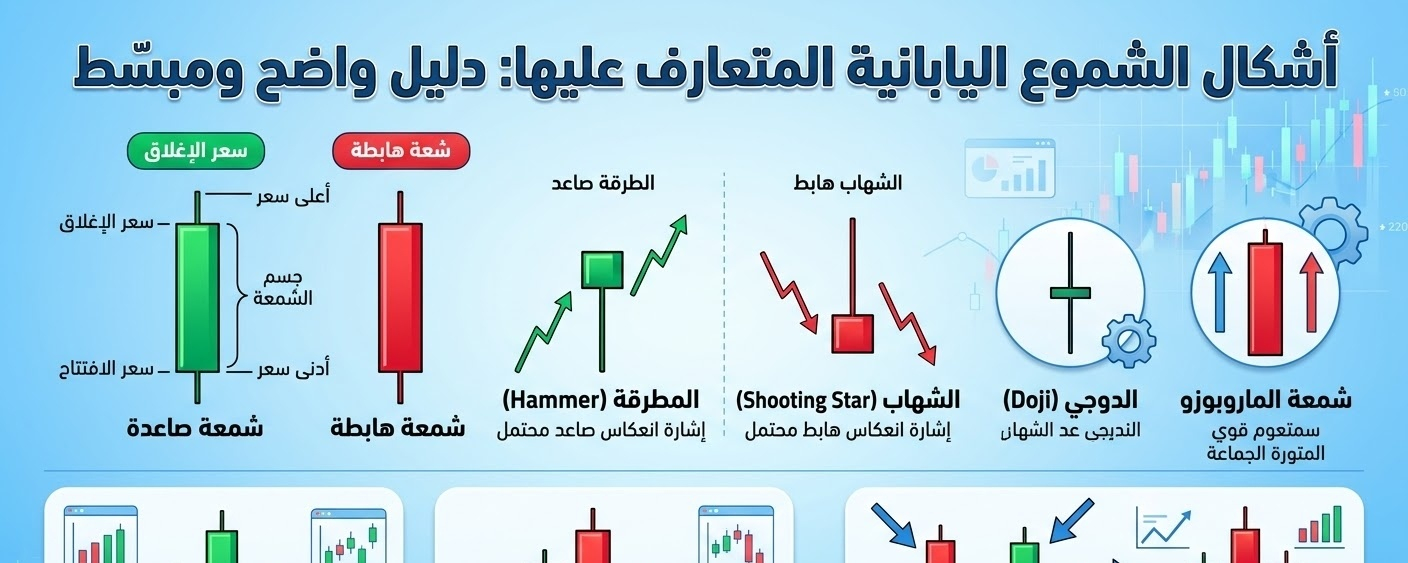
Fourth image: Japanese candlesticks - Reversal Patterns Identification
In this example, a Japanese candlestick chart is used to identify specific patterns consisting of one or more candles that indicate a possible reversal of the current price trend (from an uptrend to a downtrend, or vice versa).
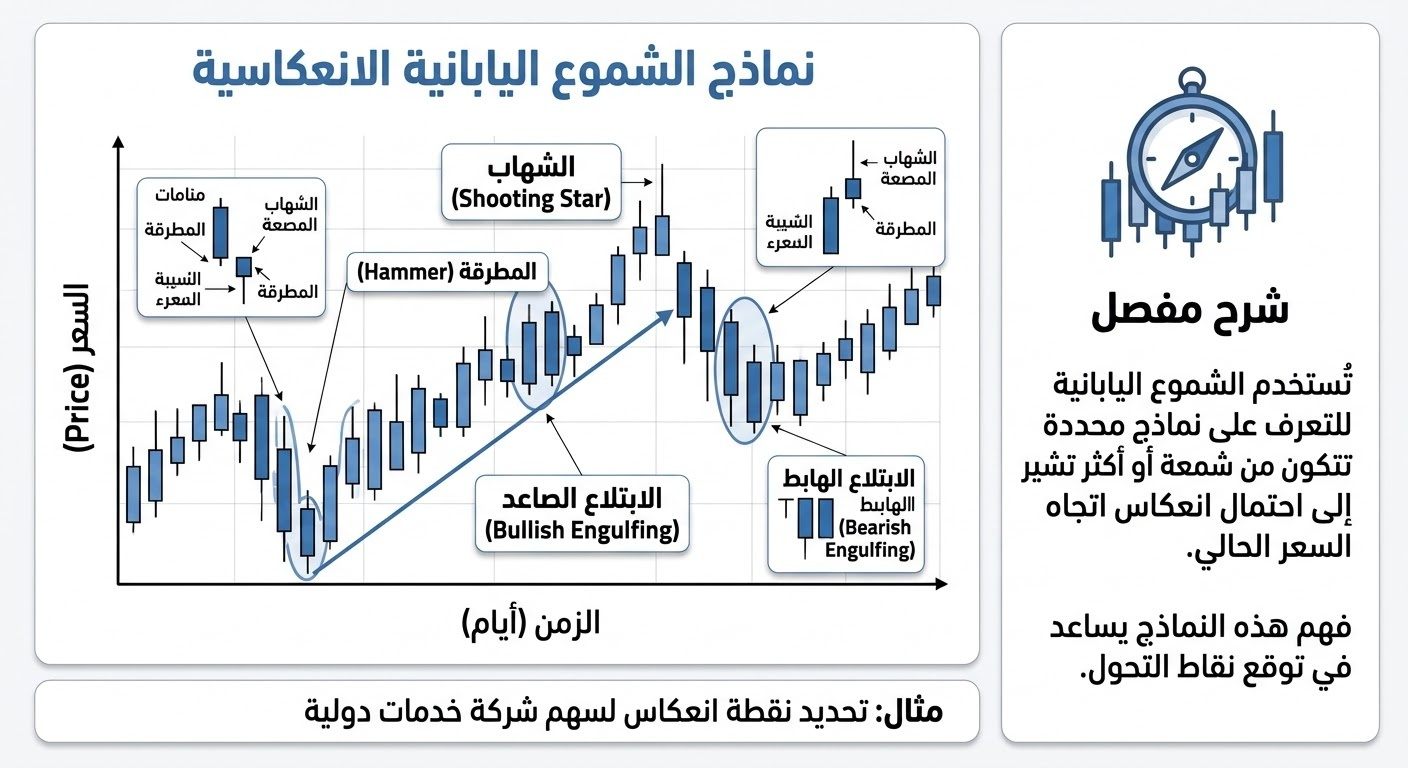
Explanation of the fourth image (Identifying reversal patterns):
Concept: The chart focuses on specific highlighted candlestick patterns. The "Hammer" pattern is identified as a bullish reversal, and the "Shooting Star" pattern as a bearish reversal, with a zoomed-in view of each pattern.
Details: The text explains that understanding these patterns (made up of one or more candles) helps predict turning points and where the trend may reverse.
#JobsReportRaisesHikeOdds #BitcoinRebounds$75KAsChipsLead #FinCENAndFedWithdraw$250CryptoTransferProposal #WillAnthropicListOnTime #USNovemberMichiganExpectationsIndexPrelimAt50.9 $NVDAB
 NVDAB187.78+1.37%
 BTC76,040+0.37%