

U.S. trader Umar Ashraf is incredibly popular. He went head-to-head with 15 losing traders on a trading show, drawing 2 million viewers—the ratings went through the roof.
He’s also a very successful trader in his own right, with over a million followers across social media. In 2021, he made $5.54 million in a single year with just one account—that’s about 37 million yuan.
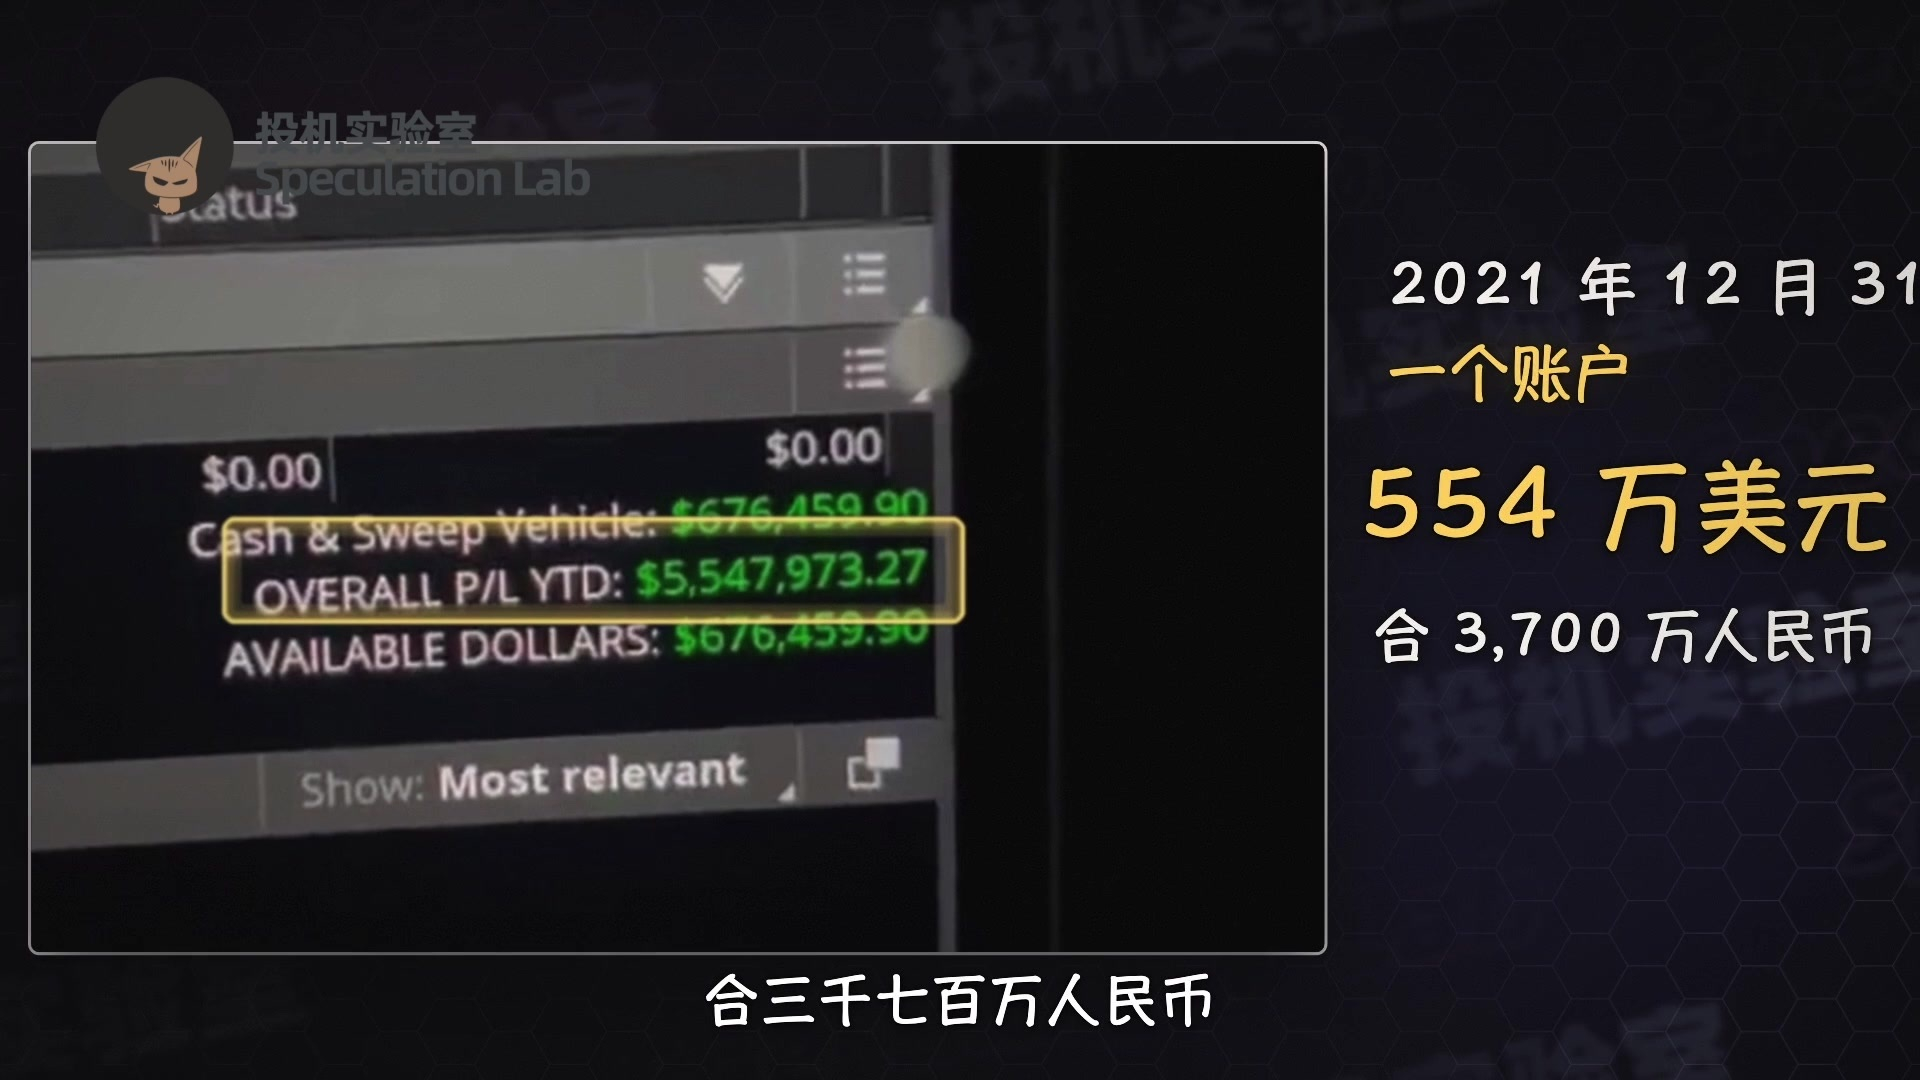
He filmed himself logging into his brokerage account on camera. He said that including his other accounts, he made over $7 million in total that year. His total profits to date have now exceeded $15 million.
He entered the industry at 18 in 2013 and has been trading for over 13 years. As his trading capital has grown, he’s focused more and more on consistent profits.
Now he trades no more than ten days a month, and calls it a day just over an hour after the market opens.

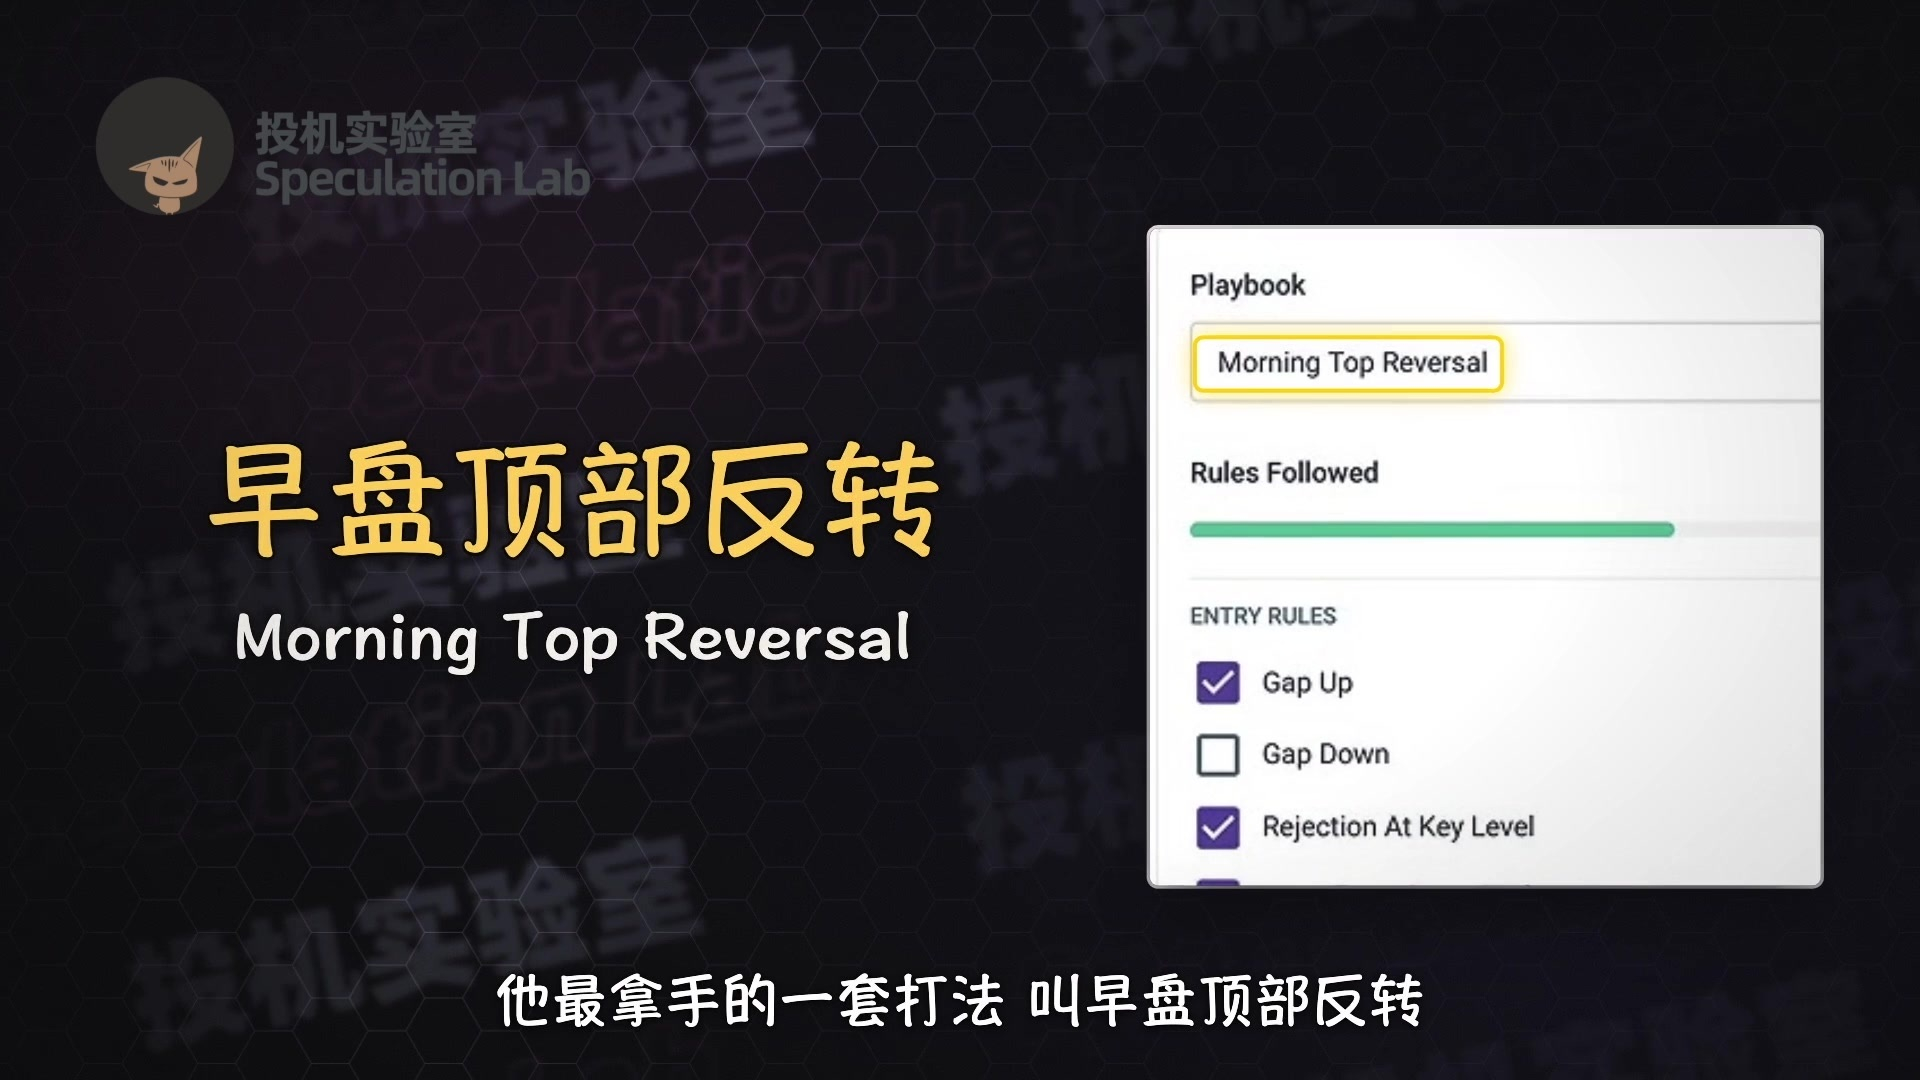
His signature strategy is called the early-session top reversal: wait for the price to surge after the open, then short it when it runs out of steam. Very few people know this strategy, and he's only explained it twice.
He talked about it on his own channel in 2023, then explained it all over again on another show in 2025. It's a simple, practical strategy, and I'm going to tell you all about it now.
His trading logic is this: for a price to keep rising, people have to keep rushing in to buy. If the price is still rising but fewer and fewer people are rushing to buy, the rally will soon run out of steam.
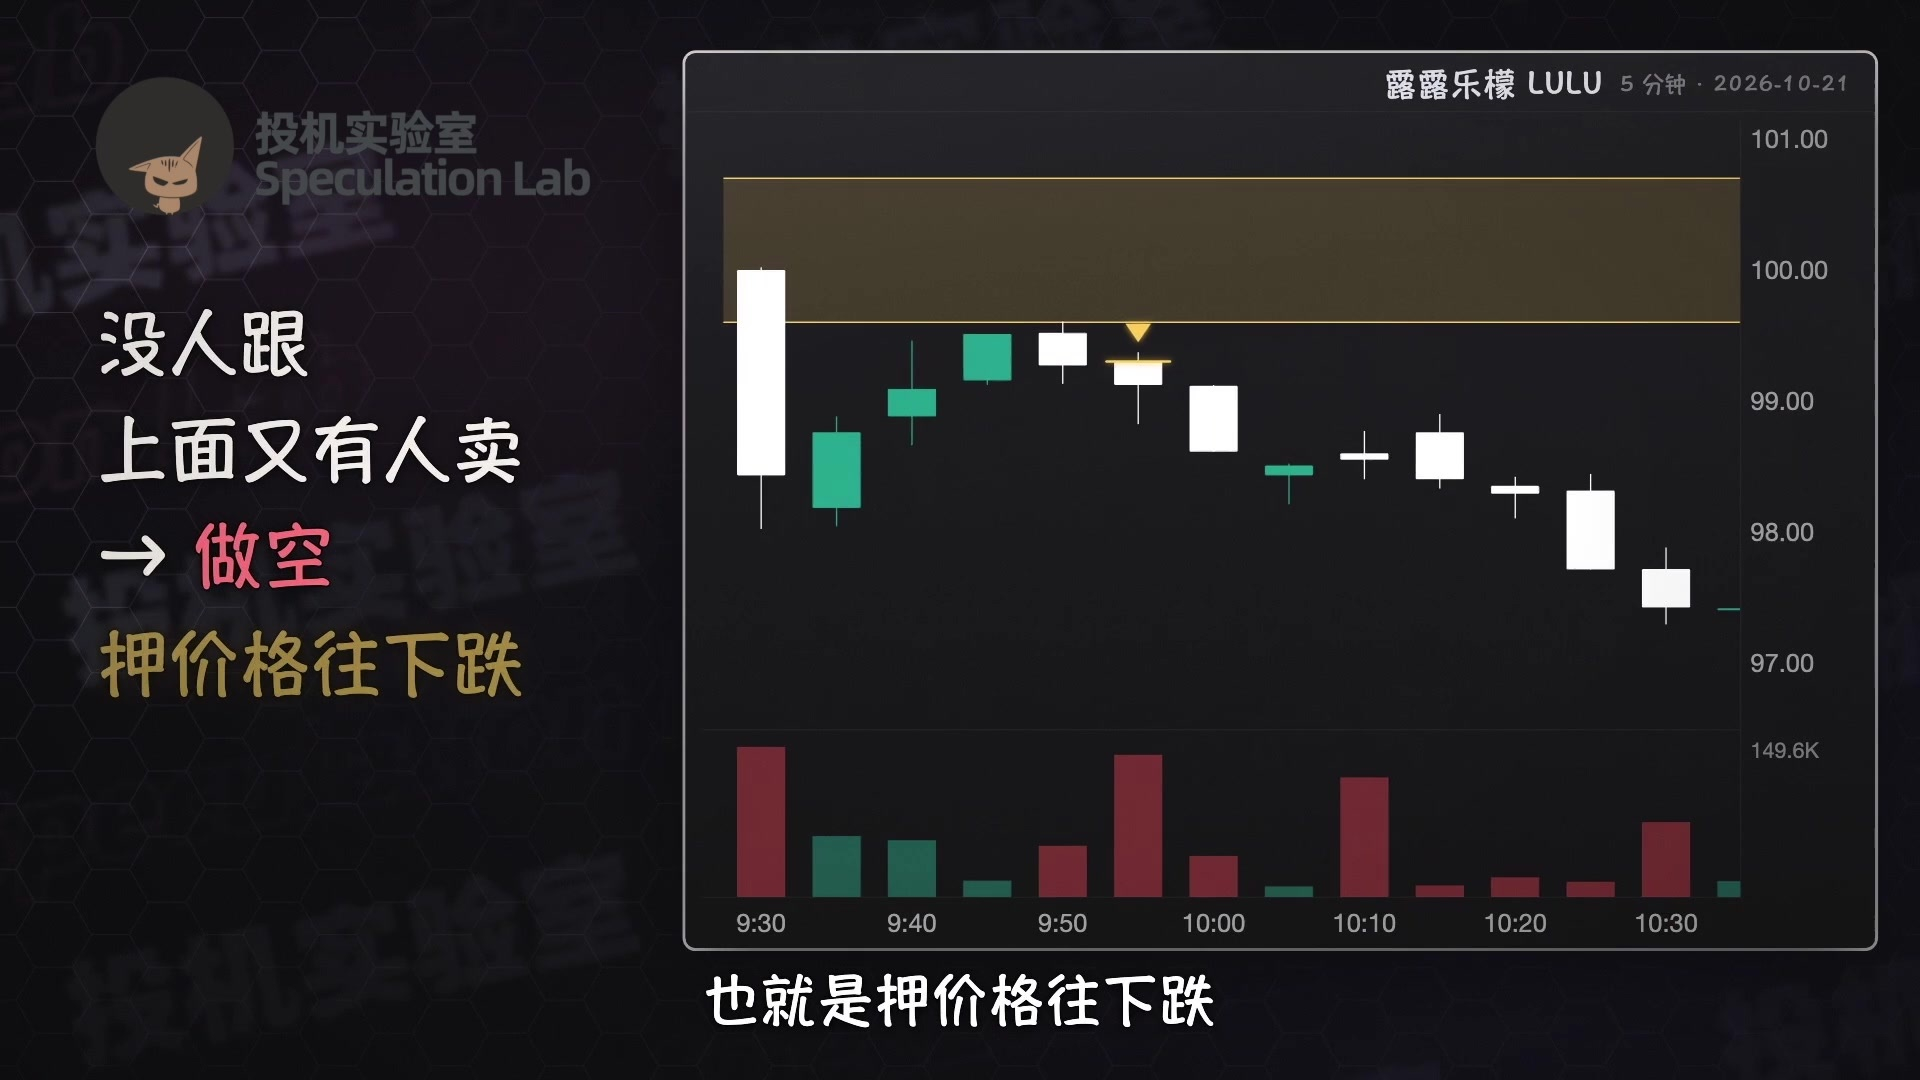
When it reaches an area where people are consistently selling, it's likely to get knocked back down. So he doesn't rush to place an order at the open. First, he lets the price surge and watches to see whether buyers follow through.
If no one follows through and sellers show up at the top, he shorts—that is, he bets the price will fall.
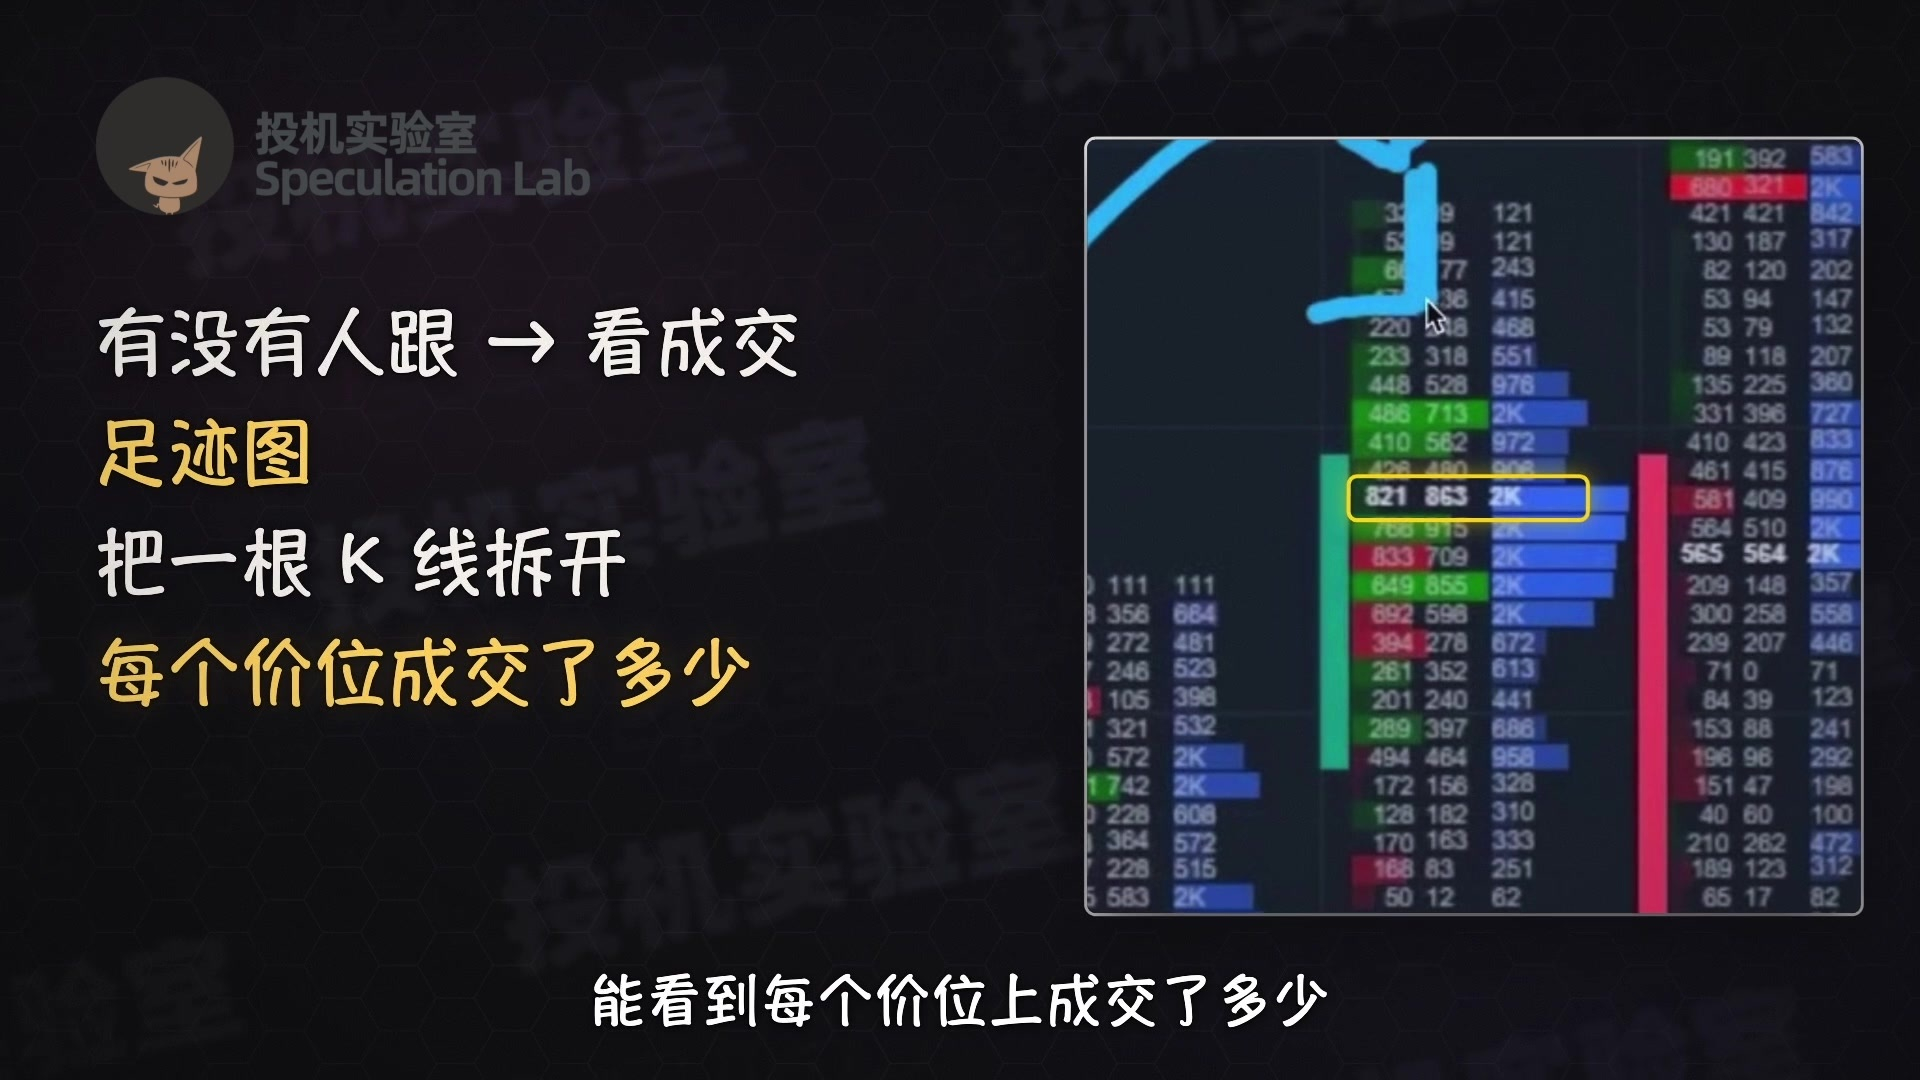
To see whether people are following through with their buying, he looks at volume. He uses a charting tool called a footprint chart, which breaks down each candle so you can see how much trading took place at every price level.
When buyers don't want to wait, they buy immediately at the seller's asking price. That's called aggressive buying. When sellers don't want to wait, they sell immediately at the buyer's bid. That's called aggressive selling.
He tracks trading in S&P 500 futures (ES), but mainly places trades in SPY options. SPY is an ETF that follows the S&P 500 index.
This strategy isn't suitable every day. He doesn't trade on days when the price moves sideways in a range. For example, during a week when the Federal Reserve is meeting, the market waits for the decision from Monday through Wednesday, so he doesn't place a single trade.
The same goes for the two hours before the Fed chair speaks. No matter how good the opportunity looks, he stays out.
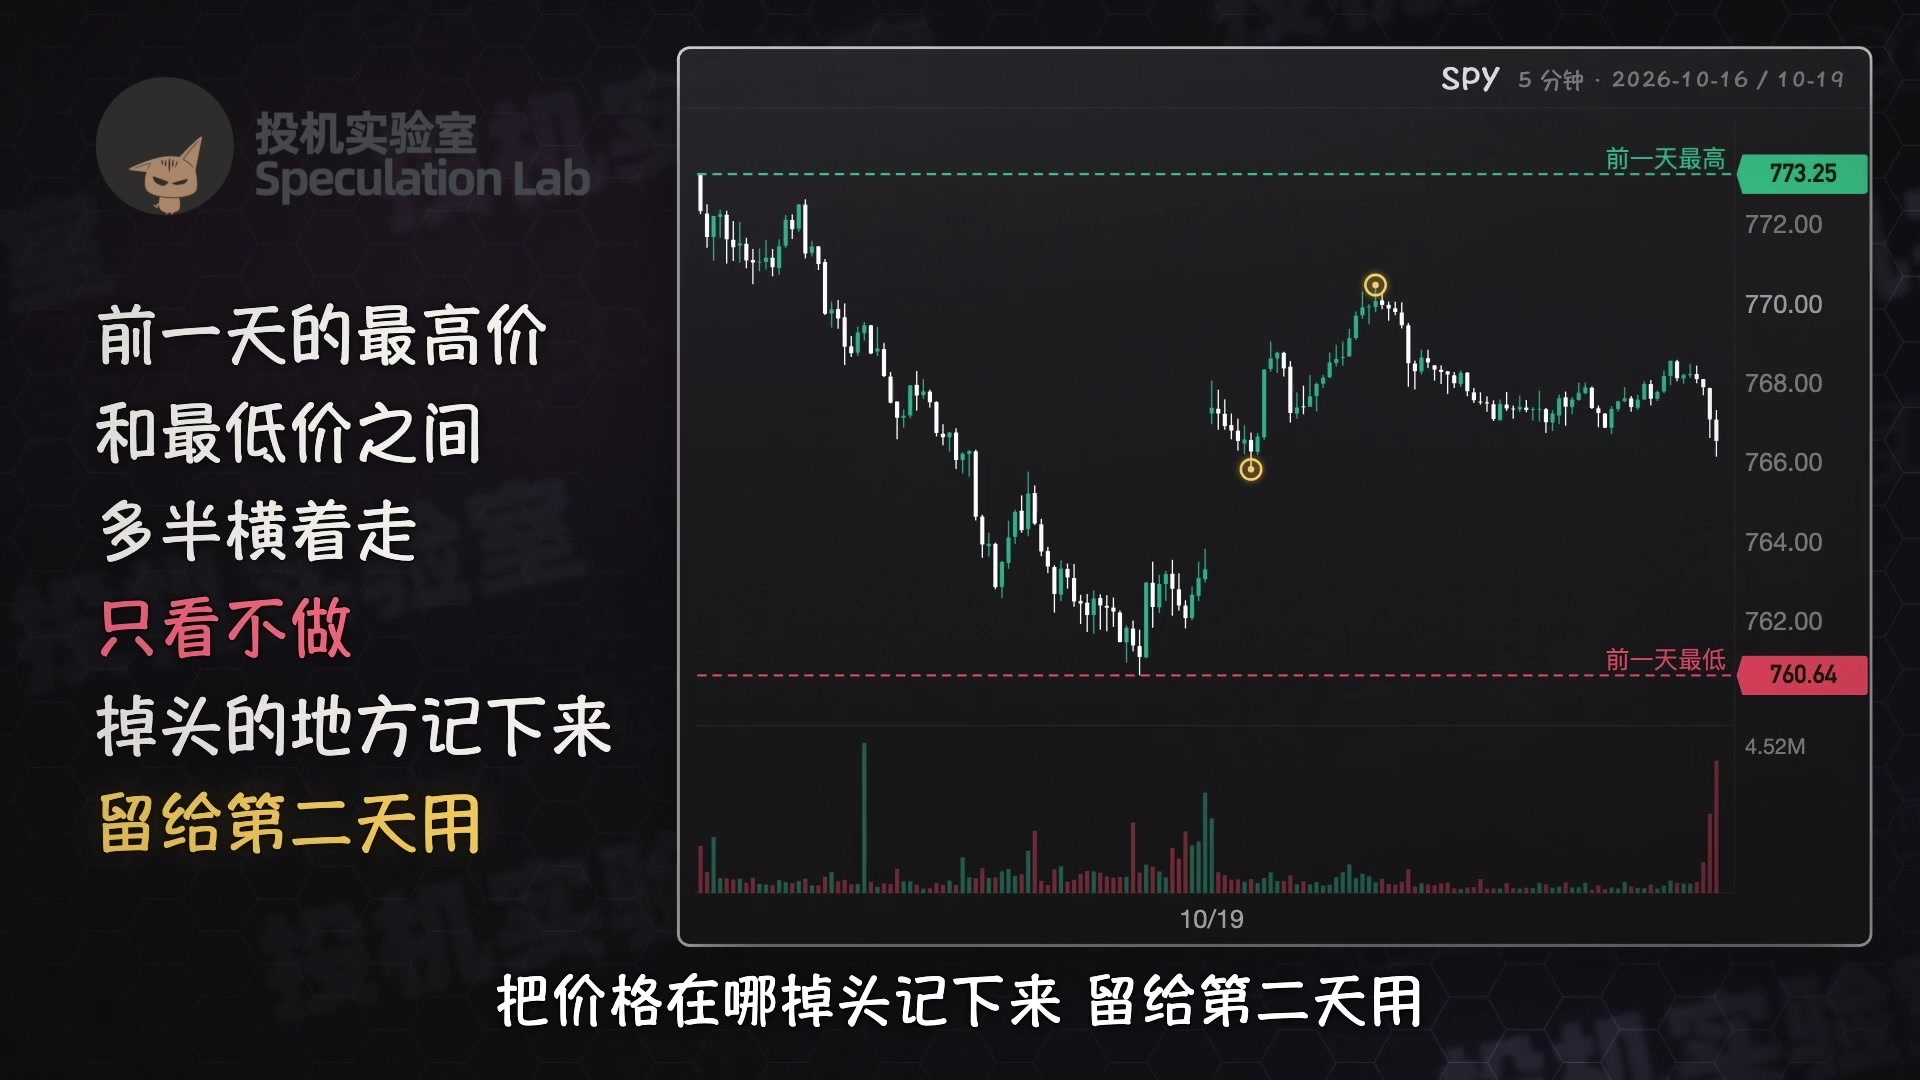
If, after the open, the price keeps moving back and forth between the previous day's high and low, the market will probably stay range-bound that day too. On days like that, just watch; don't trade. Note where the price turns and use those levels the next day.
If I open the screen and can't make sense of what's happening, I don't trade either. I'd rather feel like a fool for a day than lose money.
On a day he intends to trade, he must sit down at the computer with a written plan half an hour before the open. Otherwise, he doesn't trade that day. There's no boss overseeing you in trading, so you have to set your own rules and stick to them.
He recommends that beginners sit down an hour early to settle their emotions.
First, write down the major events coming up this week, such as a Fed meeting, the nonfarm payrolls report, and Trump's posts.
When these things happen, prices can suddenly start moving erratically.

Then mark the key levels on the chart. The most important ones are places where the price touched and turned in the past few days.
For example, if the price rose to $100 three times in the past few days and was sold off each time, then the area around $100 is a supply zone. It shows that sellers are always waiting up there.
That area only counts if it's been relevant over the past few trading days. The opening price for the day is also a key level.
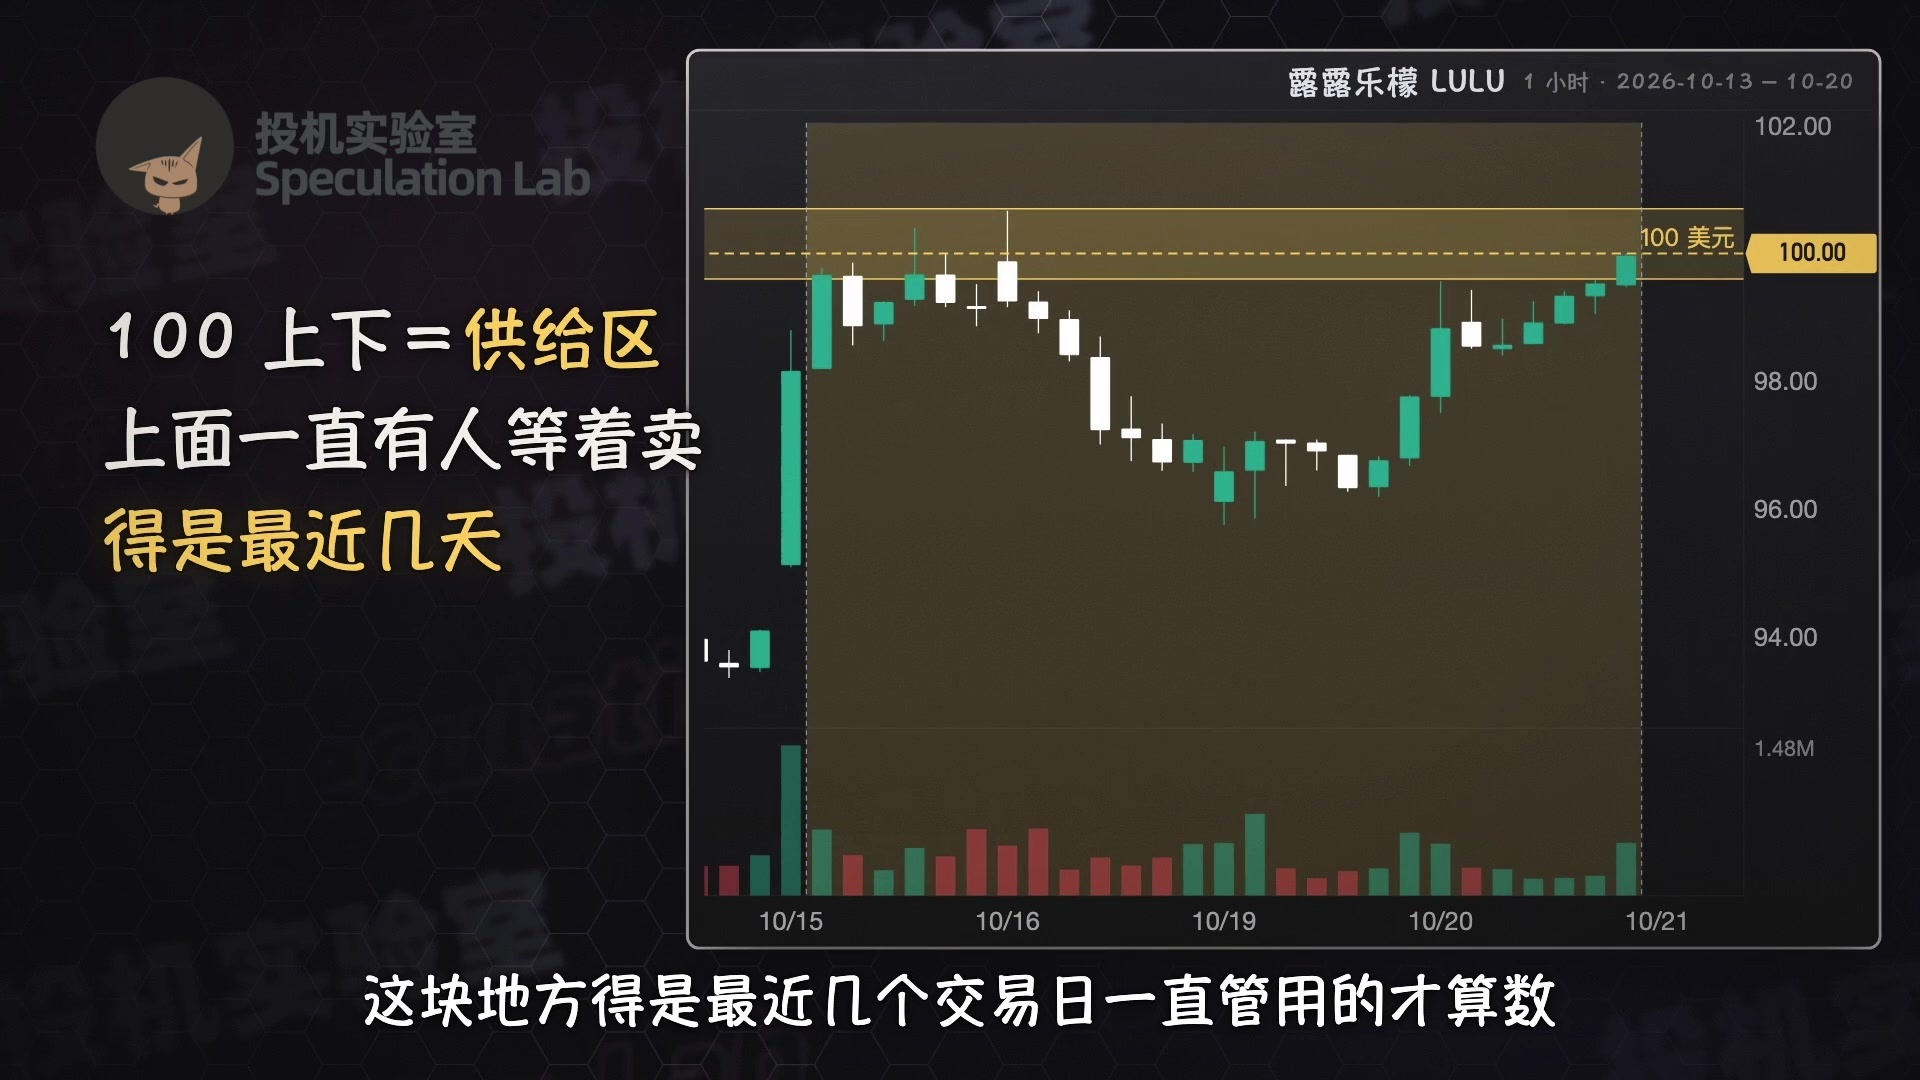
Finally, write down a few possible scenarios, and spell out exactly what you need to see before entering in each one. For example, if the market gaps down today and then rallies back to the $100 supply zone after the open, look for a shorting opportunity there.
If you've decided you want to short, make yourself write down a reason to go long too, so you don't focus on just one side. This lesson cost him more than a million dollars in losses.

In August 2025, he made $940,000 in a month and felt very confident. When September came, he was convinced the broader market would fall, so he only looked for short trades.
On September 18, right after the Fed cut rates, SPY gapped up. Just over ten minutes after the open, he bought nearly 1,000 put options. These options only make money if their price falls.
Instead, the price kept climbing. He didn't cut his losses and held on until 10:30. That trade lost him $179,000.
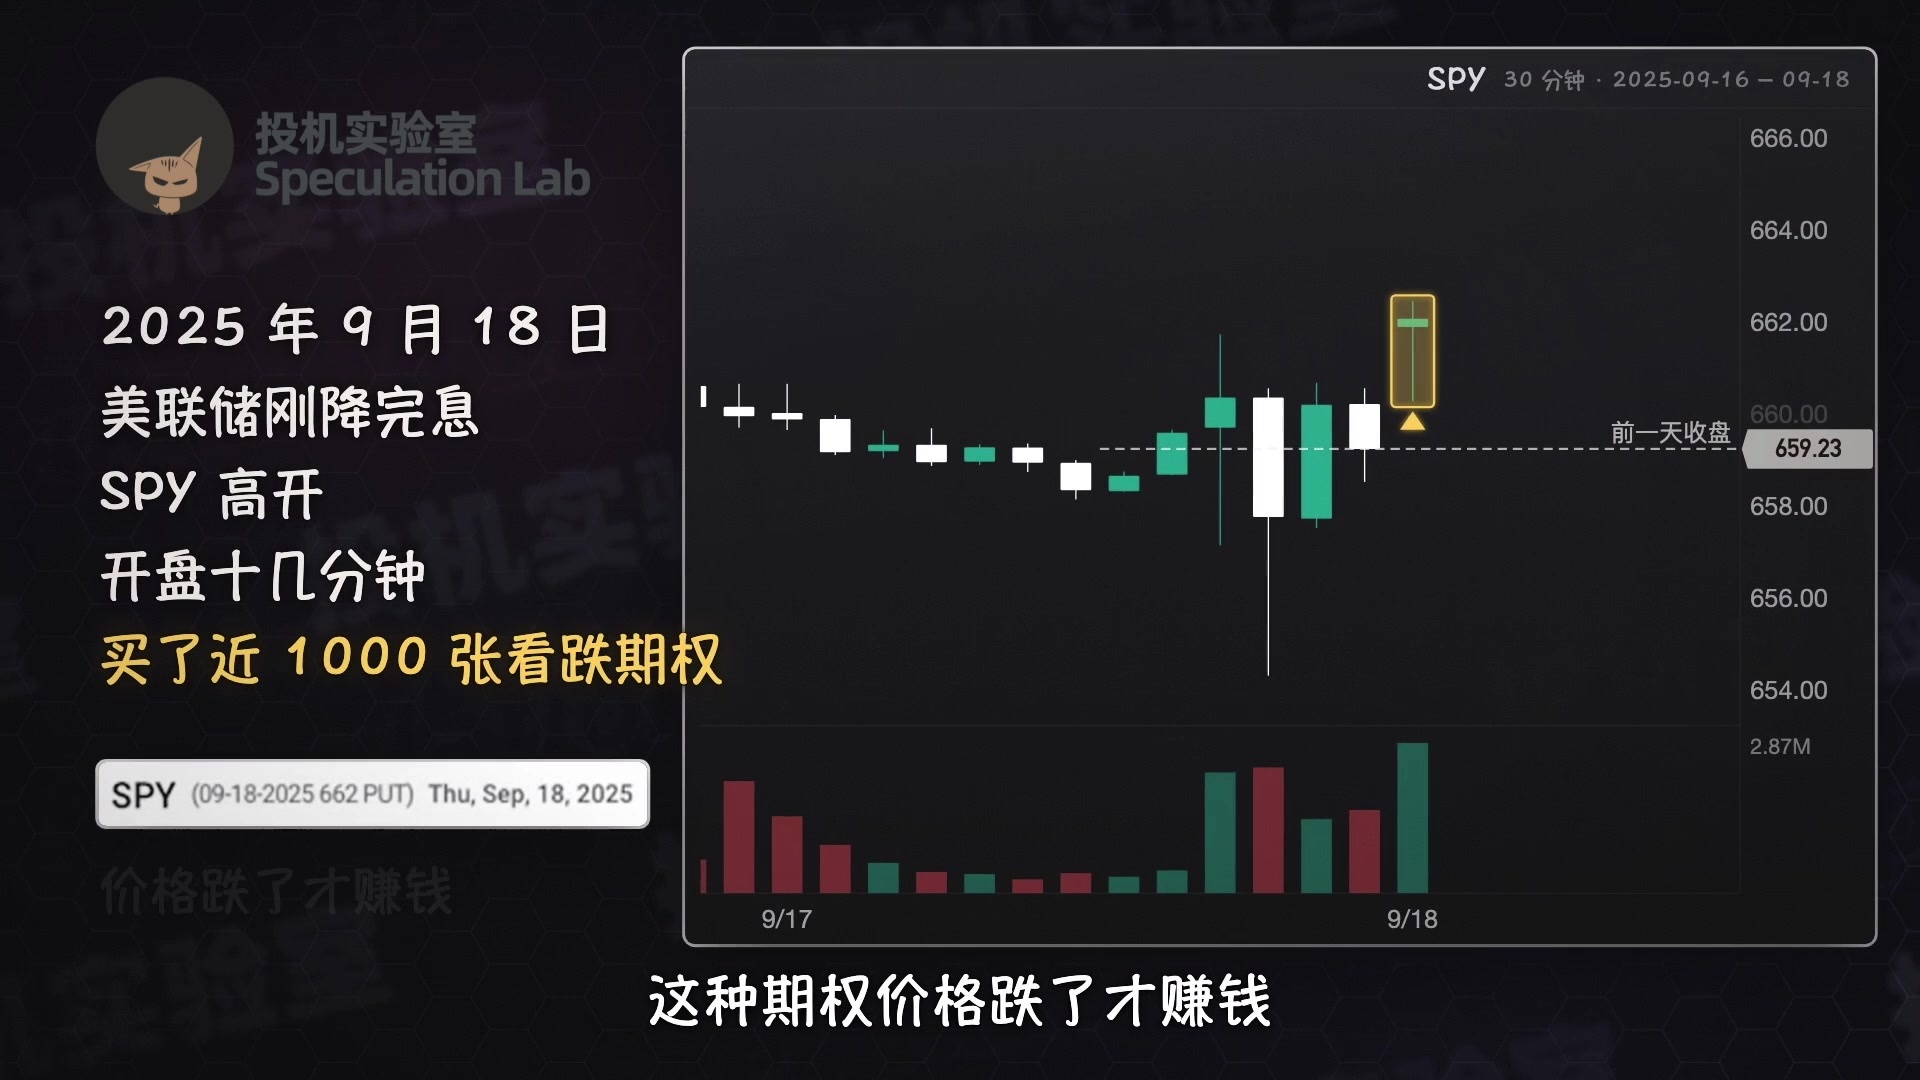
He said that if he'd cut his losses at the day's high, he would have lost only $60,000 or $70,000 at most. The account statement he shared showed a total loss of $1.39 million for that month.
Looking back, he realized that most of his trades in September were bad: for example, entering with a bias, not following the plan, or even failing to strictly honor his stop-loss.

Once the plan is written, you just wait for the market to open at 9:30 a.m. Eastern Time—9:30 p.m. in Beijing during summer and 10:30 p.m. in winter. Don't do anything for the first few minutes after the open. Trading is so fast then that no one can tell who's buying and who's selling.
Wait at least seven to ten minutes, and see which way the price moves first.
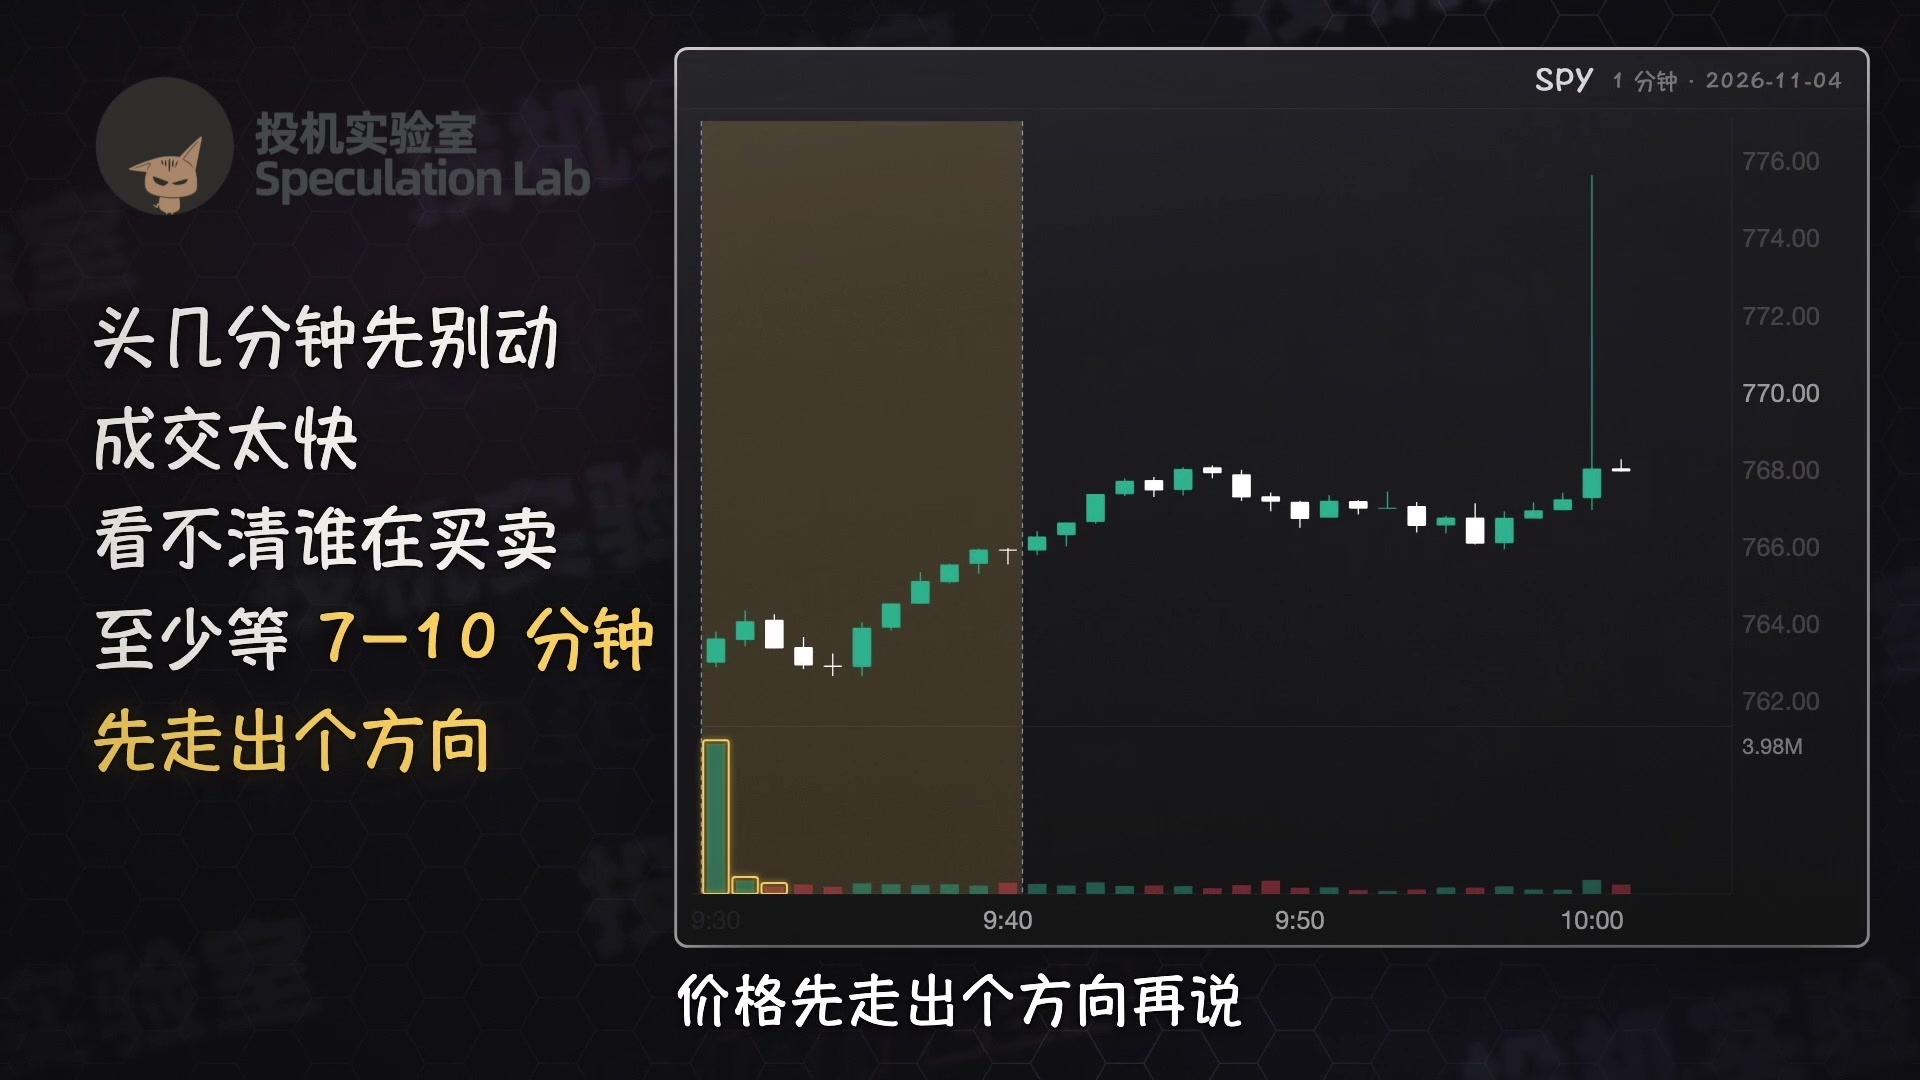
This strategy only looks for opportunities during roughly the first hour after the open. He calls it a day after 11. Sitting in front of the computer too long can make you place random trades if you haven't made money after a few hours.
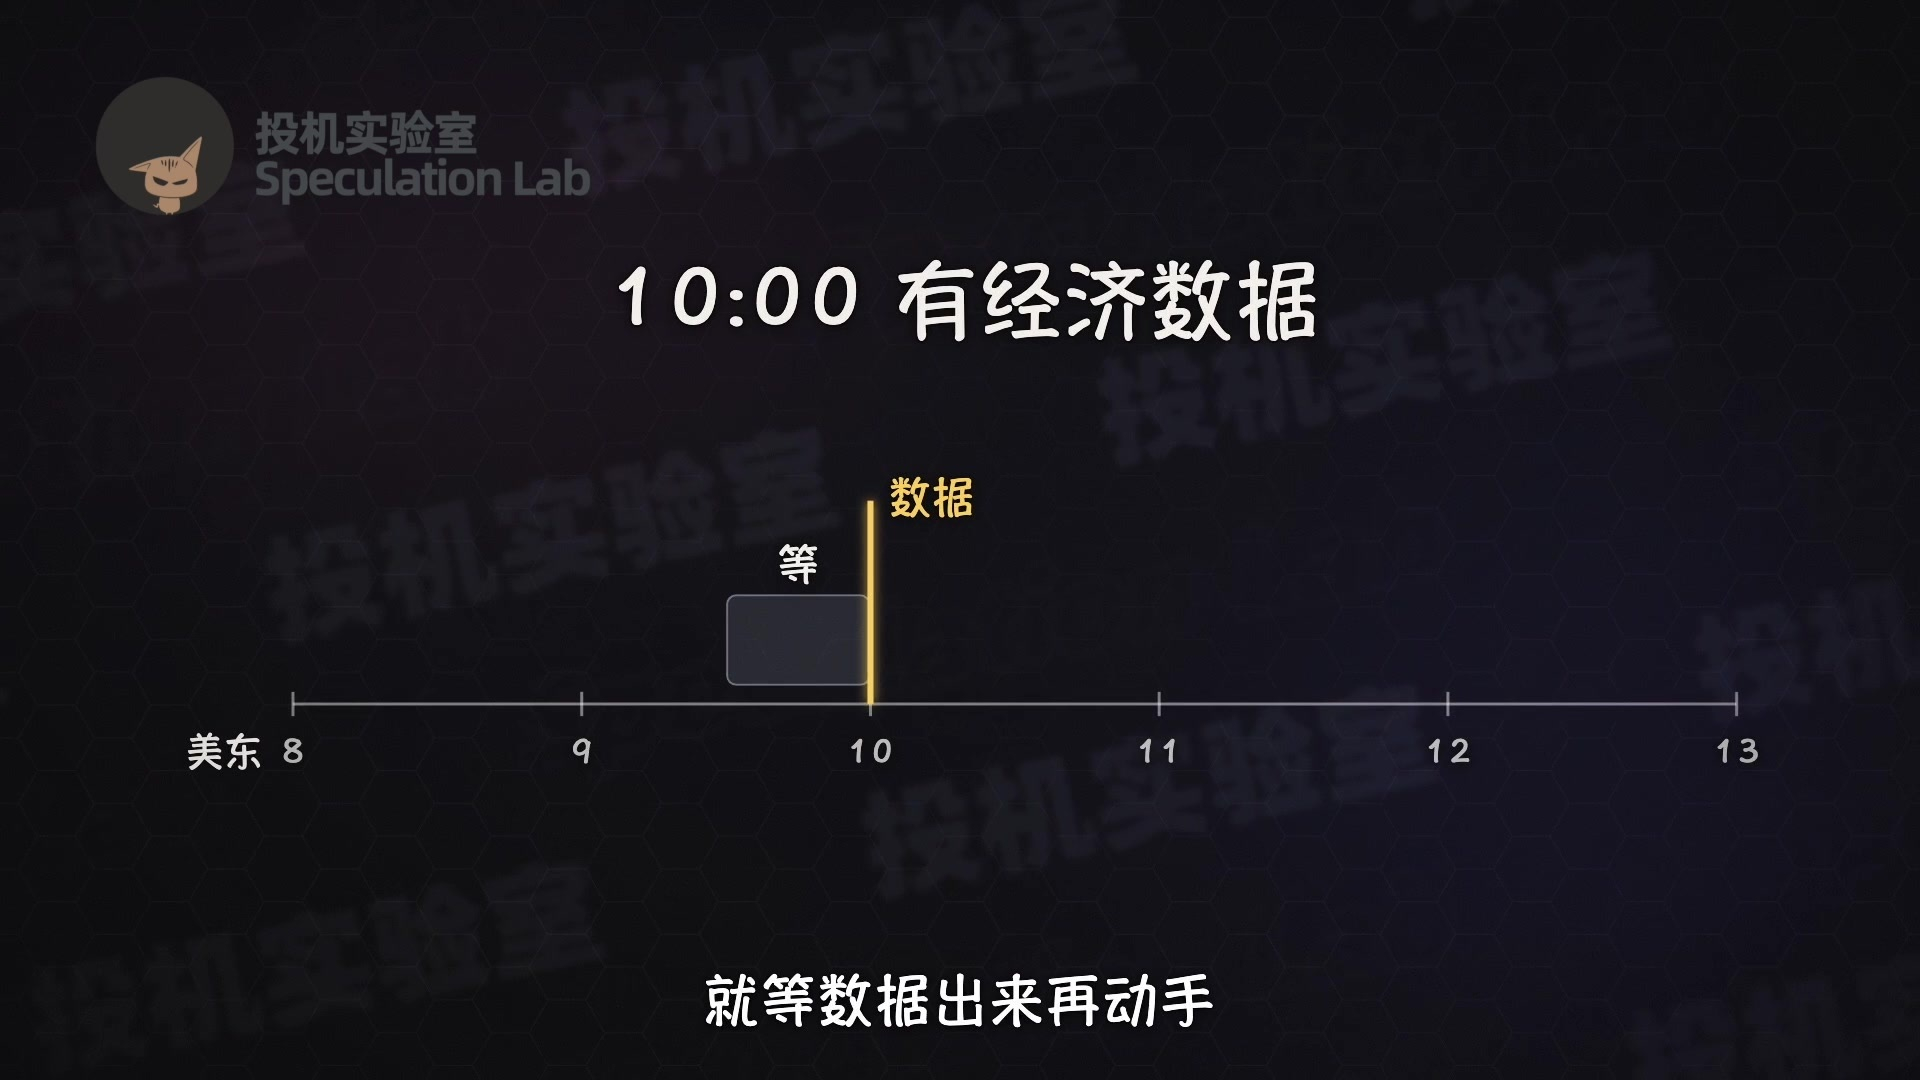
If there's an economic report at 10, wait for it to come out before making a move.
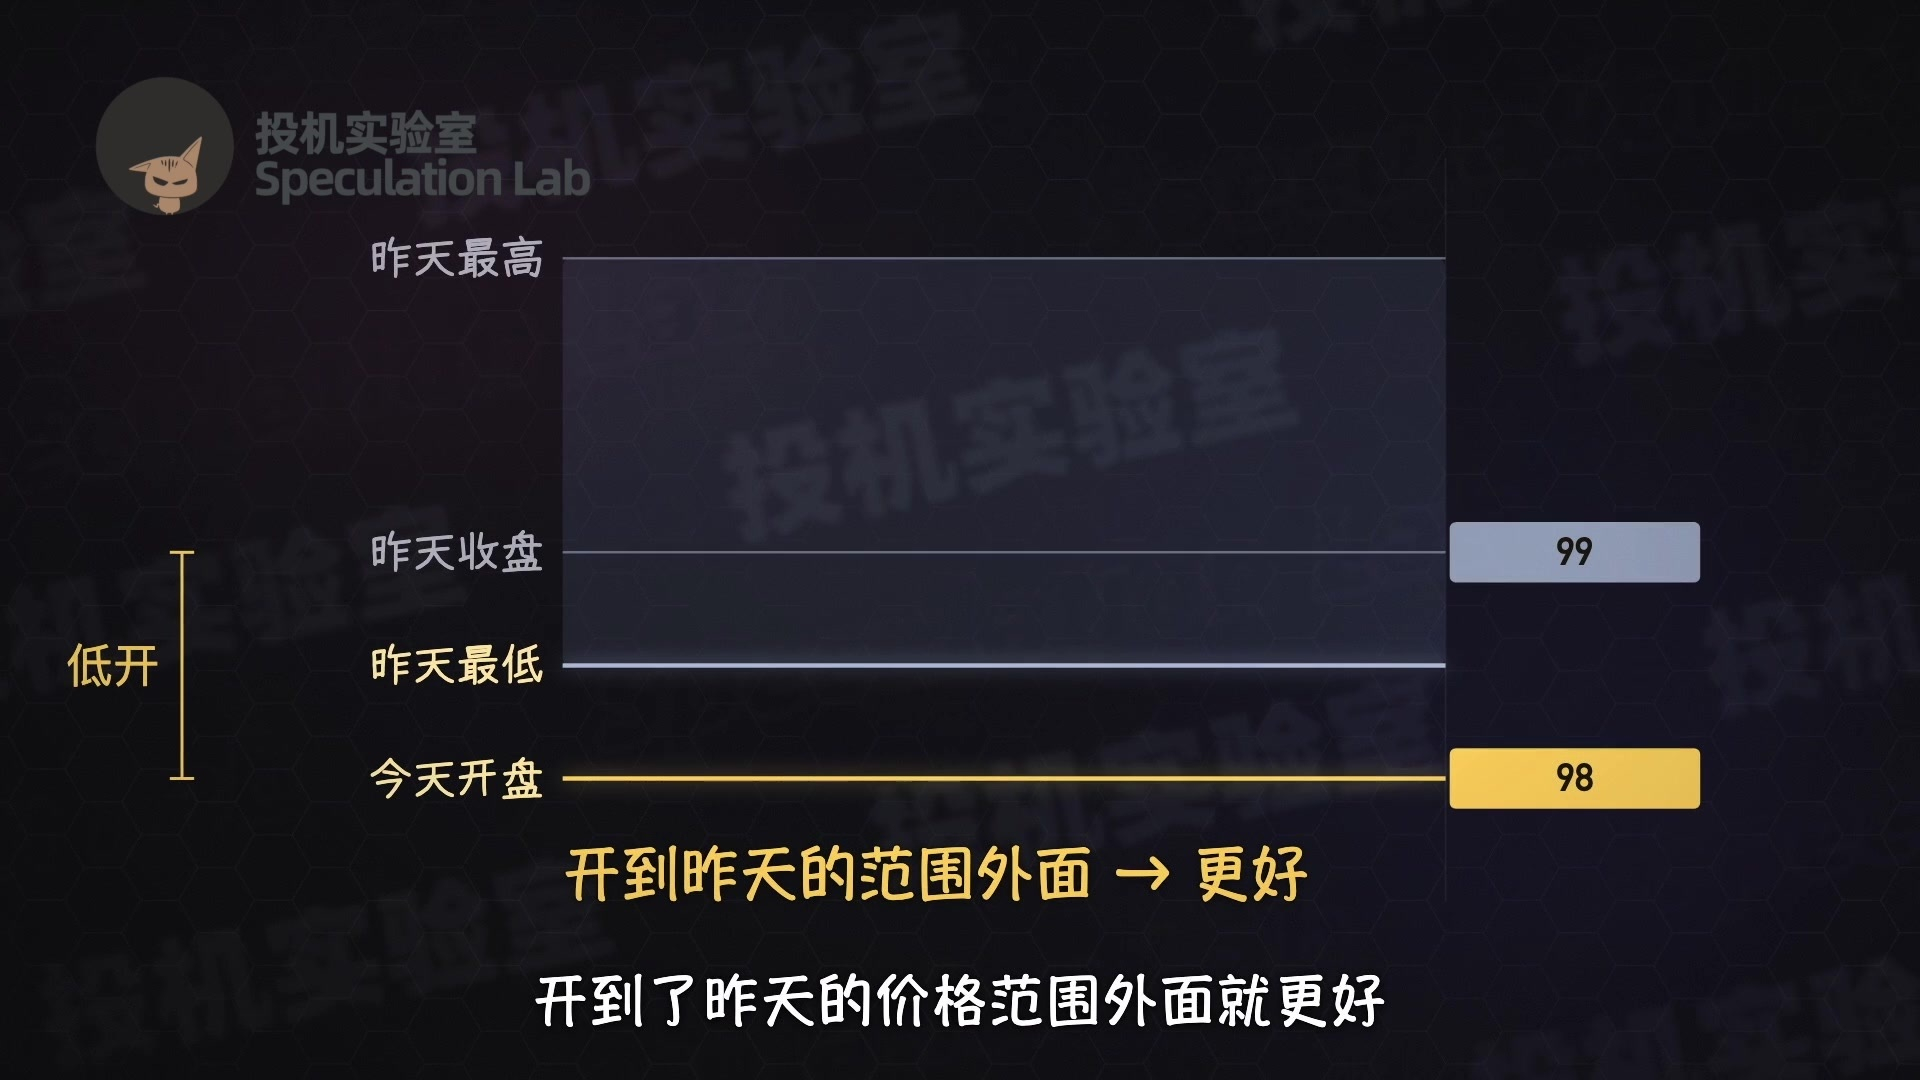
You only enter when all three conditions are met. The first is a gap at the open, ideally a gap down.
For example, if SPY closed at $99 yesterday and opens at $98 today, the opening price is well below yesterday's close. That's a gap down.
It's even better if the opening price is below yesterday's low, opening outside yesterday's trading range.
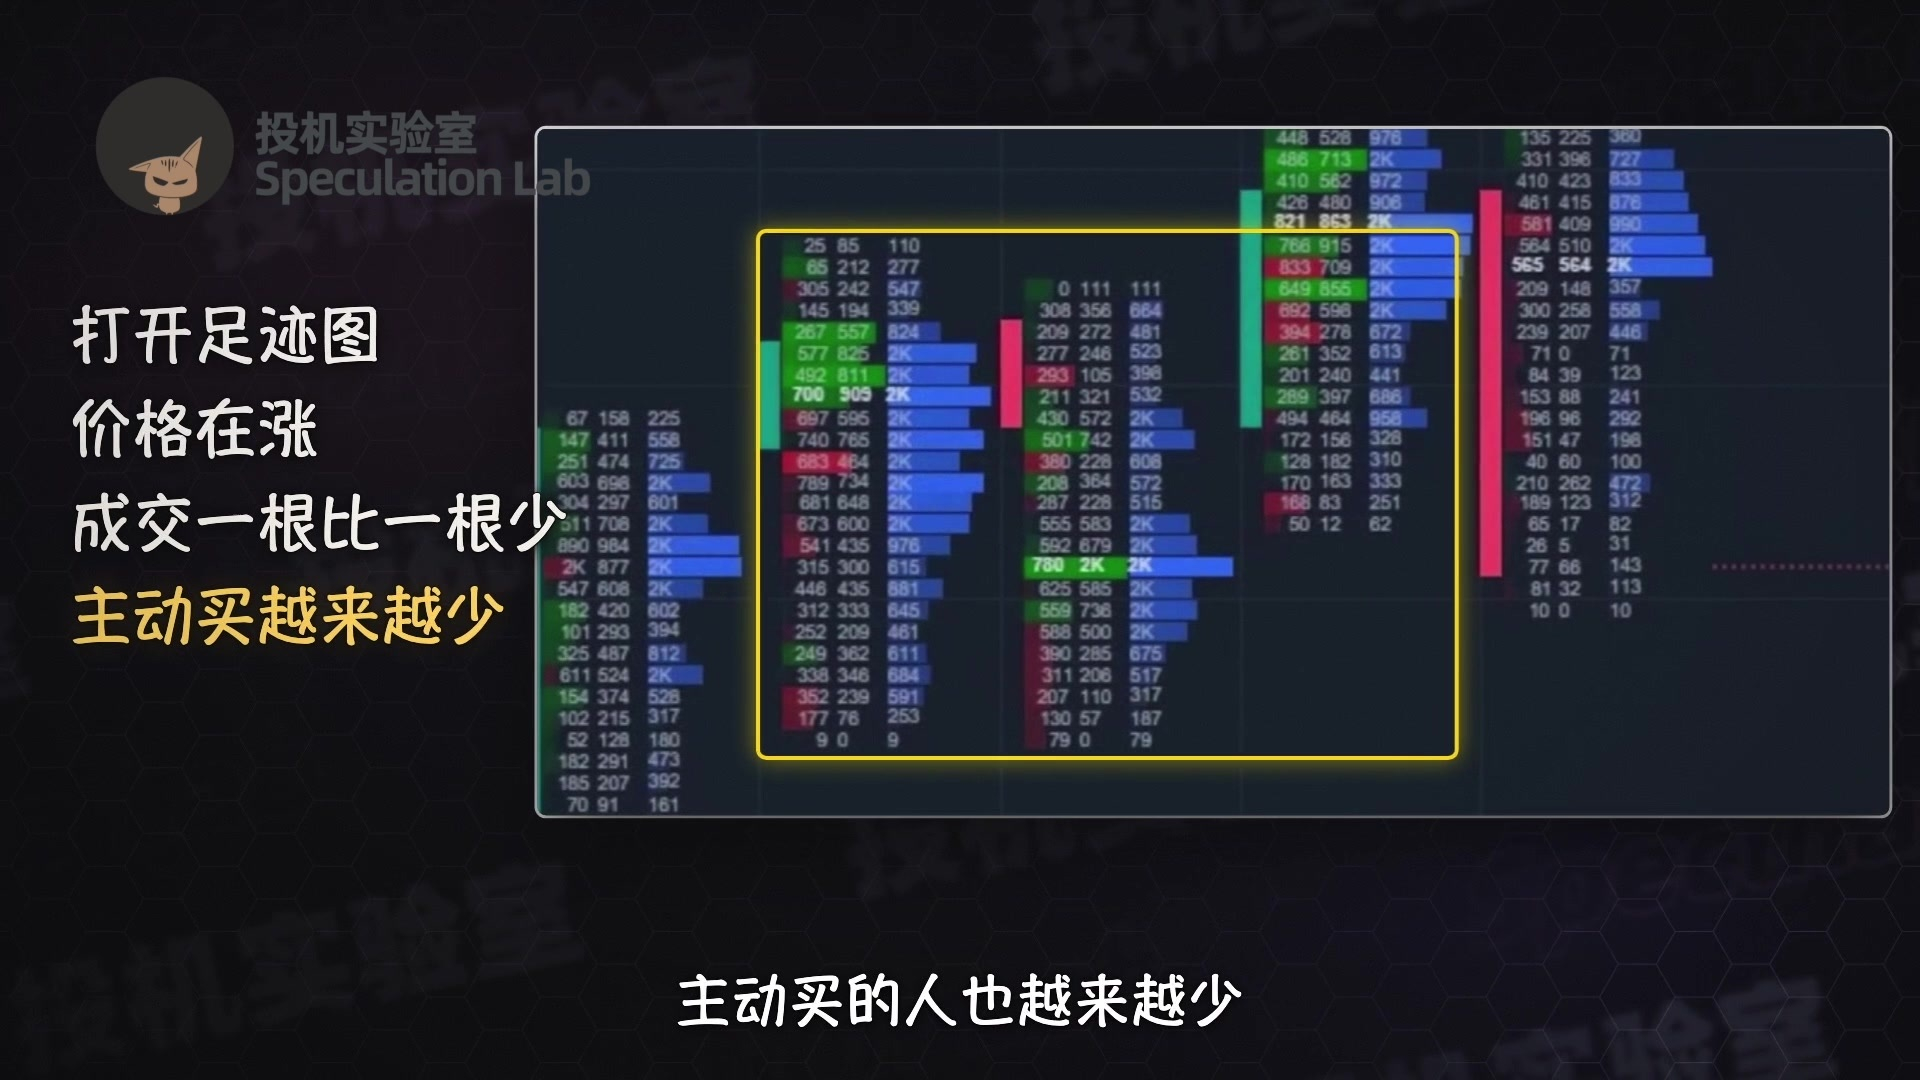
The second condition is that the price initially moves up after the open, but nobody joins in to chase the move. If it drops straight down after gapping lower, don't chase it—that kind of move usually bounces back. Wait for the price to try moving up first.
As it moves up, open the footprint chart. If the price is rising but volume on each five-minute candle is getting lower, and there are fewer and fewer aggressive buyers, that means there's no one behind the move to carry it further.
He looks at five-minute charts. Beginners should use at least five-minute charts too; one- or two-minute charts are too messy.
The third condition is that the price reaches a key level above and gets rejected.
Using the same example, when the price climbs back toward $100, volume suddenly slows down or aggressive sell orders start appearing. That's when you can short.
If even one of the three conditions isn't clear, don't trade.
If the broader market has already fallen for three or four days in a row and moves are especially volatile, don't short even if the setup looks right. And don't increase your position size if you do trade.
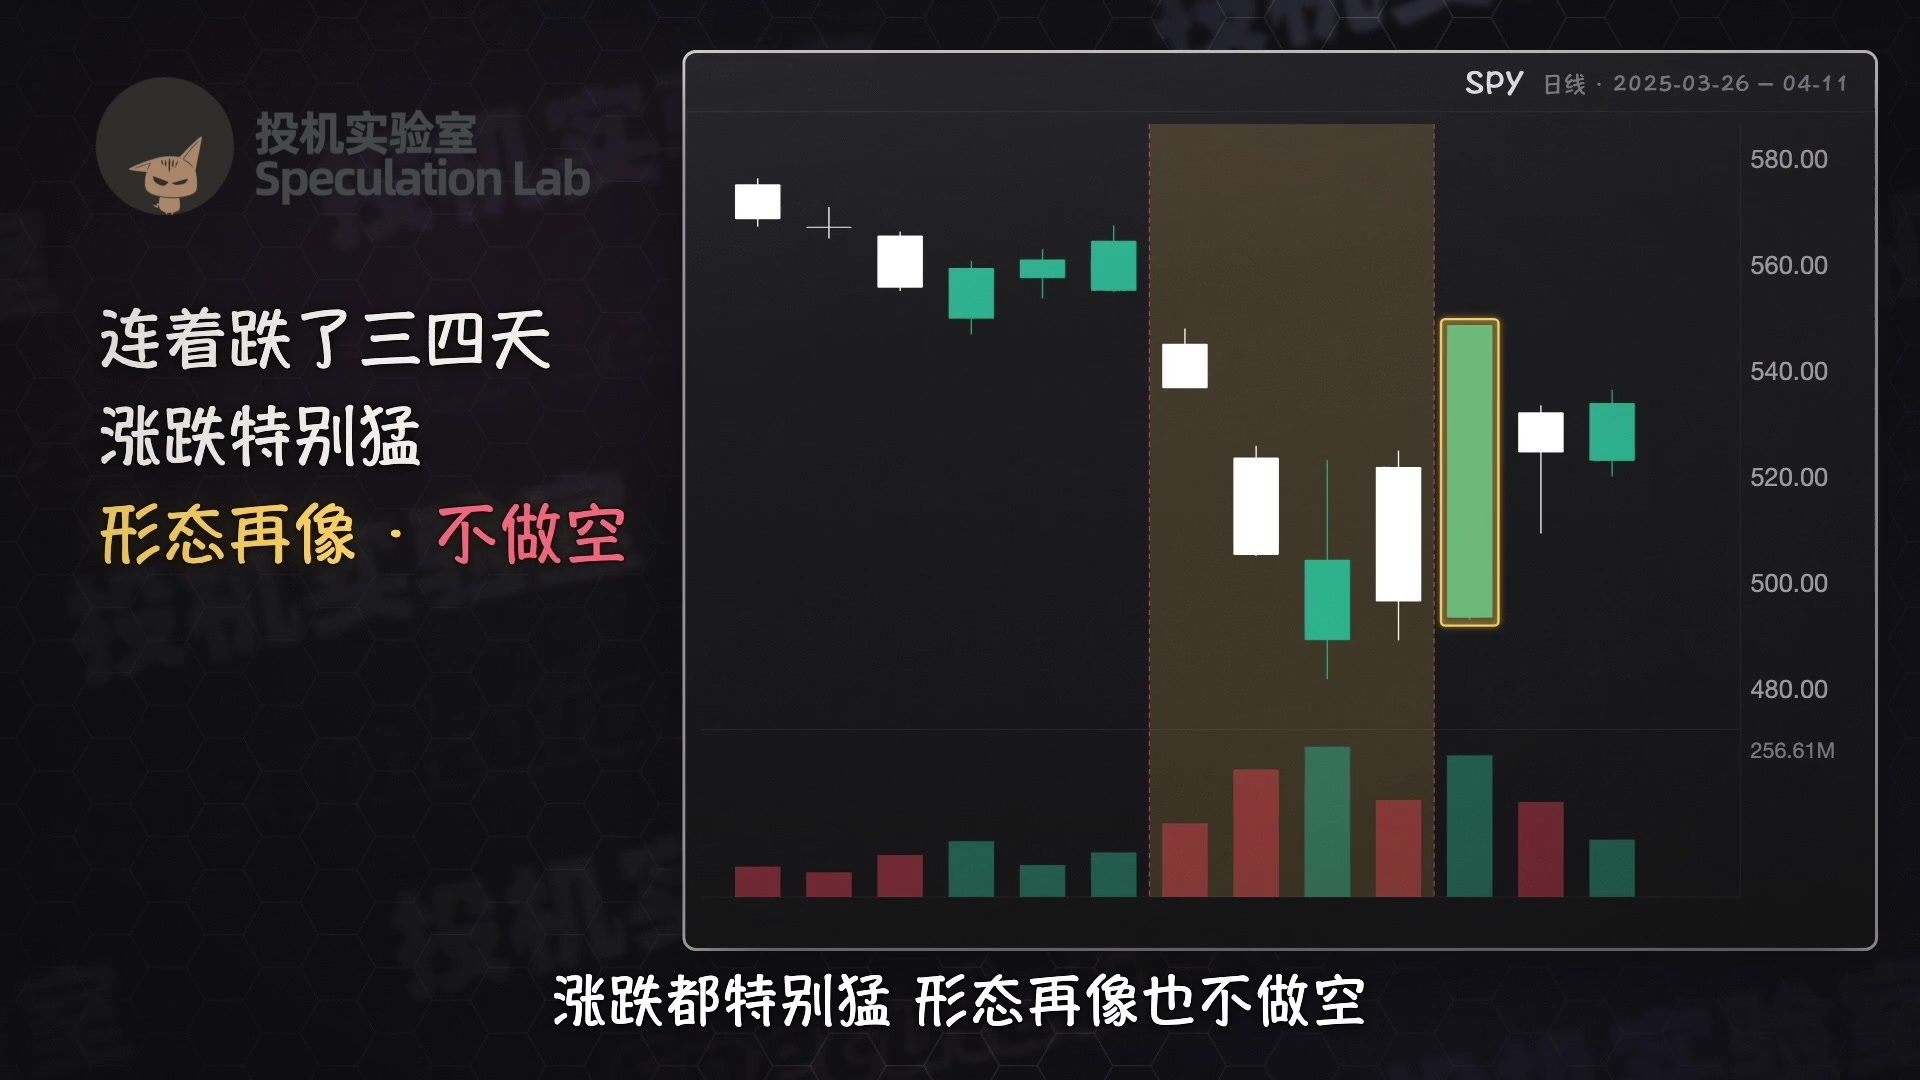
Place the stop-loss above the key level. If the price gets back above $100 or keeps making new highs, that means no one's selling up there. Your idea was wrong, so get out immediately.
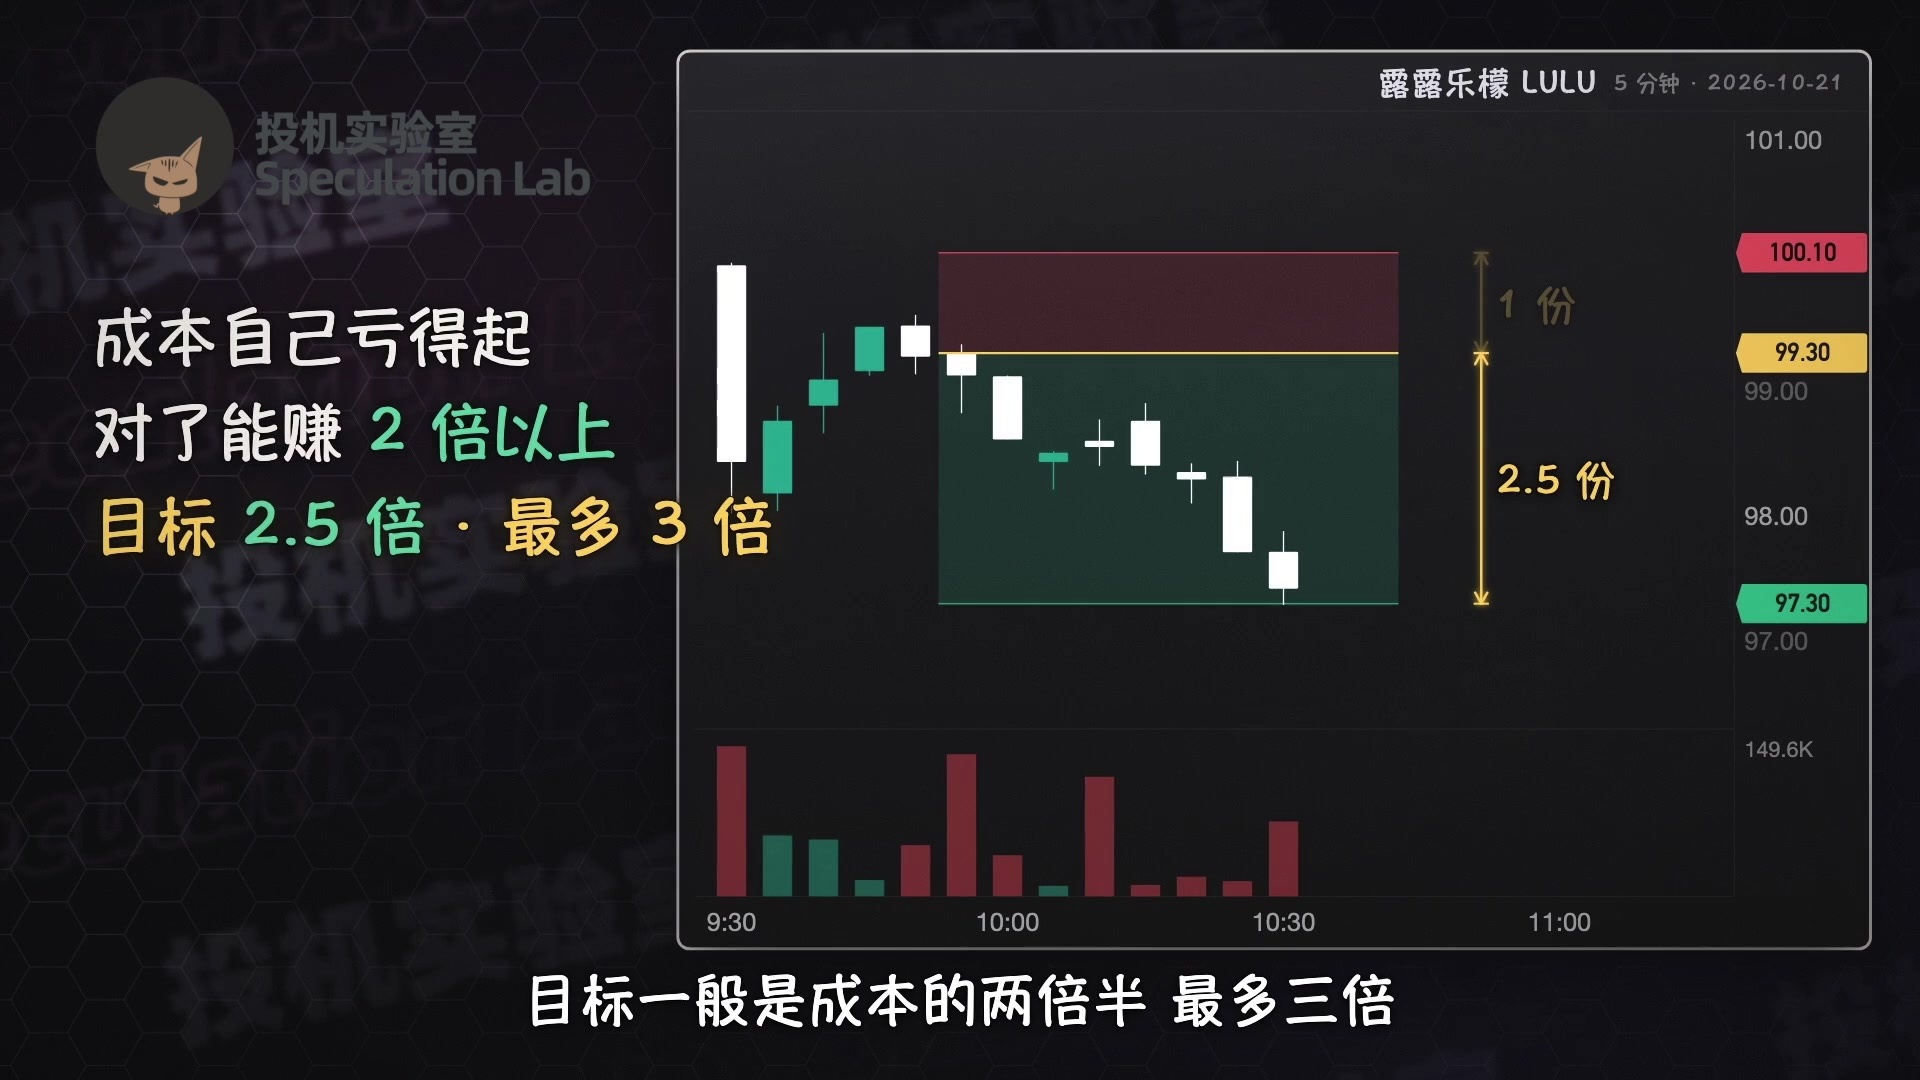
Before placing an order, calculate how much you stand to lose if you're wrong. He calls that amount the cost of the trade. Only take the trade if you can afford to lose that amount and, if you're right, can make at least twice as much.
The target is usually two and a half times the cost, with a maximum of three times. For example, if you can lose up to $1,000, your target would be around $2,500.
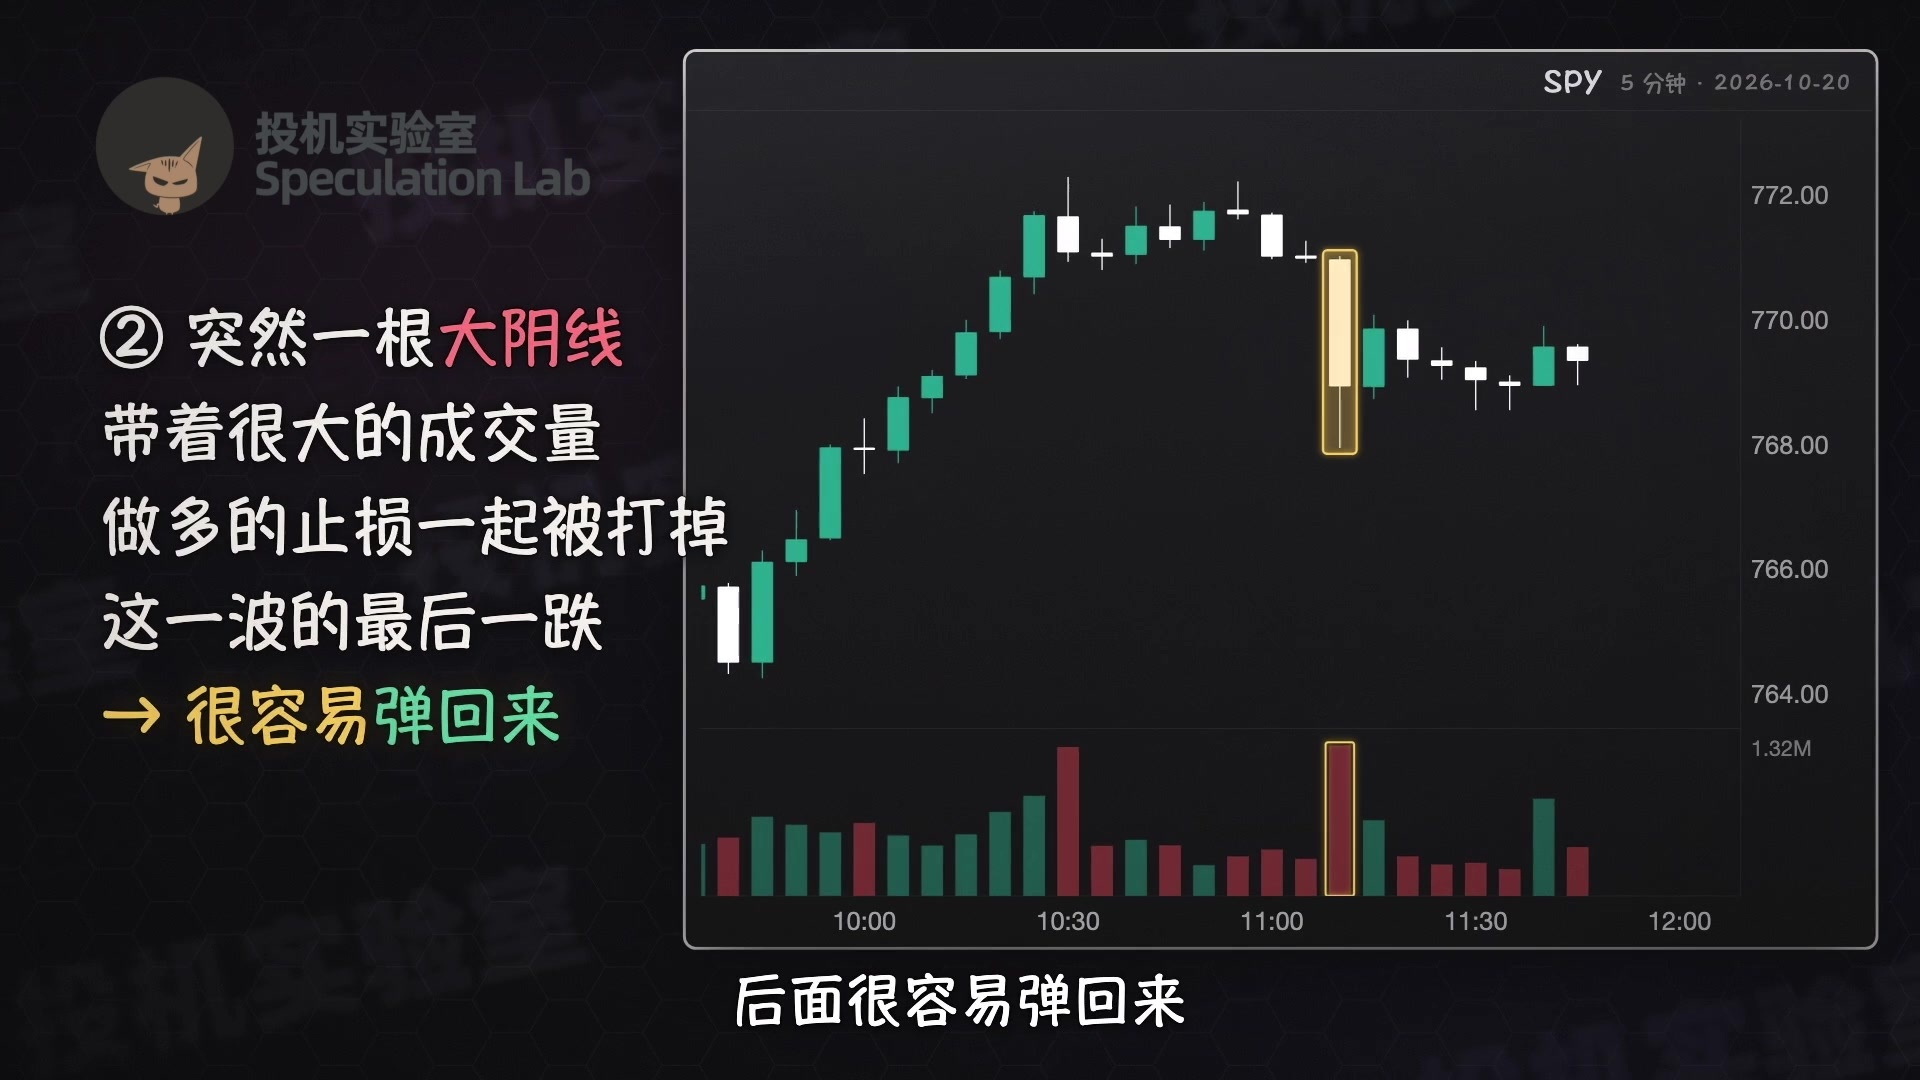
There are two exit signals: first, the price falls to the day's low or back near the opening price; second, a very long bearish candle suddenly appears, with heavy volume driving the price down. This often means the stop-losses of long traders have all been triggered. It's the final leg down in that move, and a bounce is likely afterward.
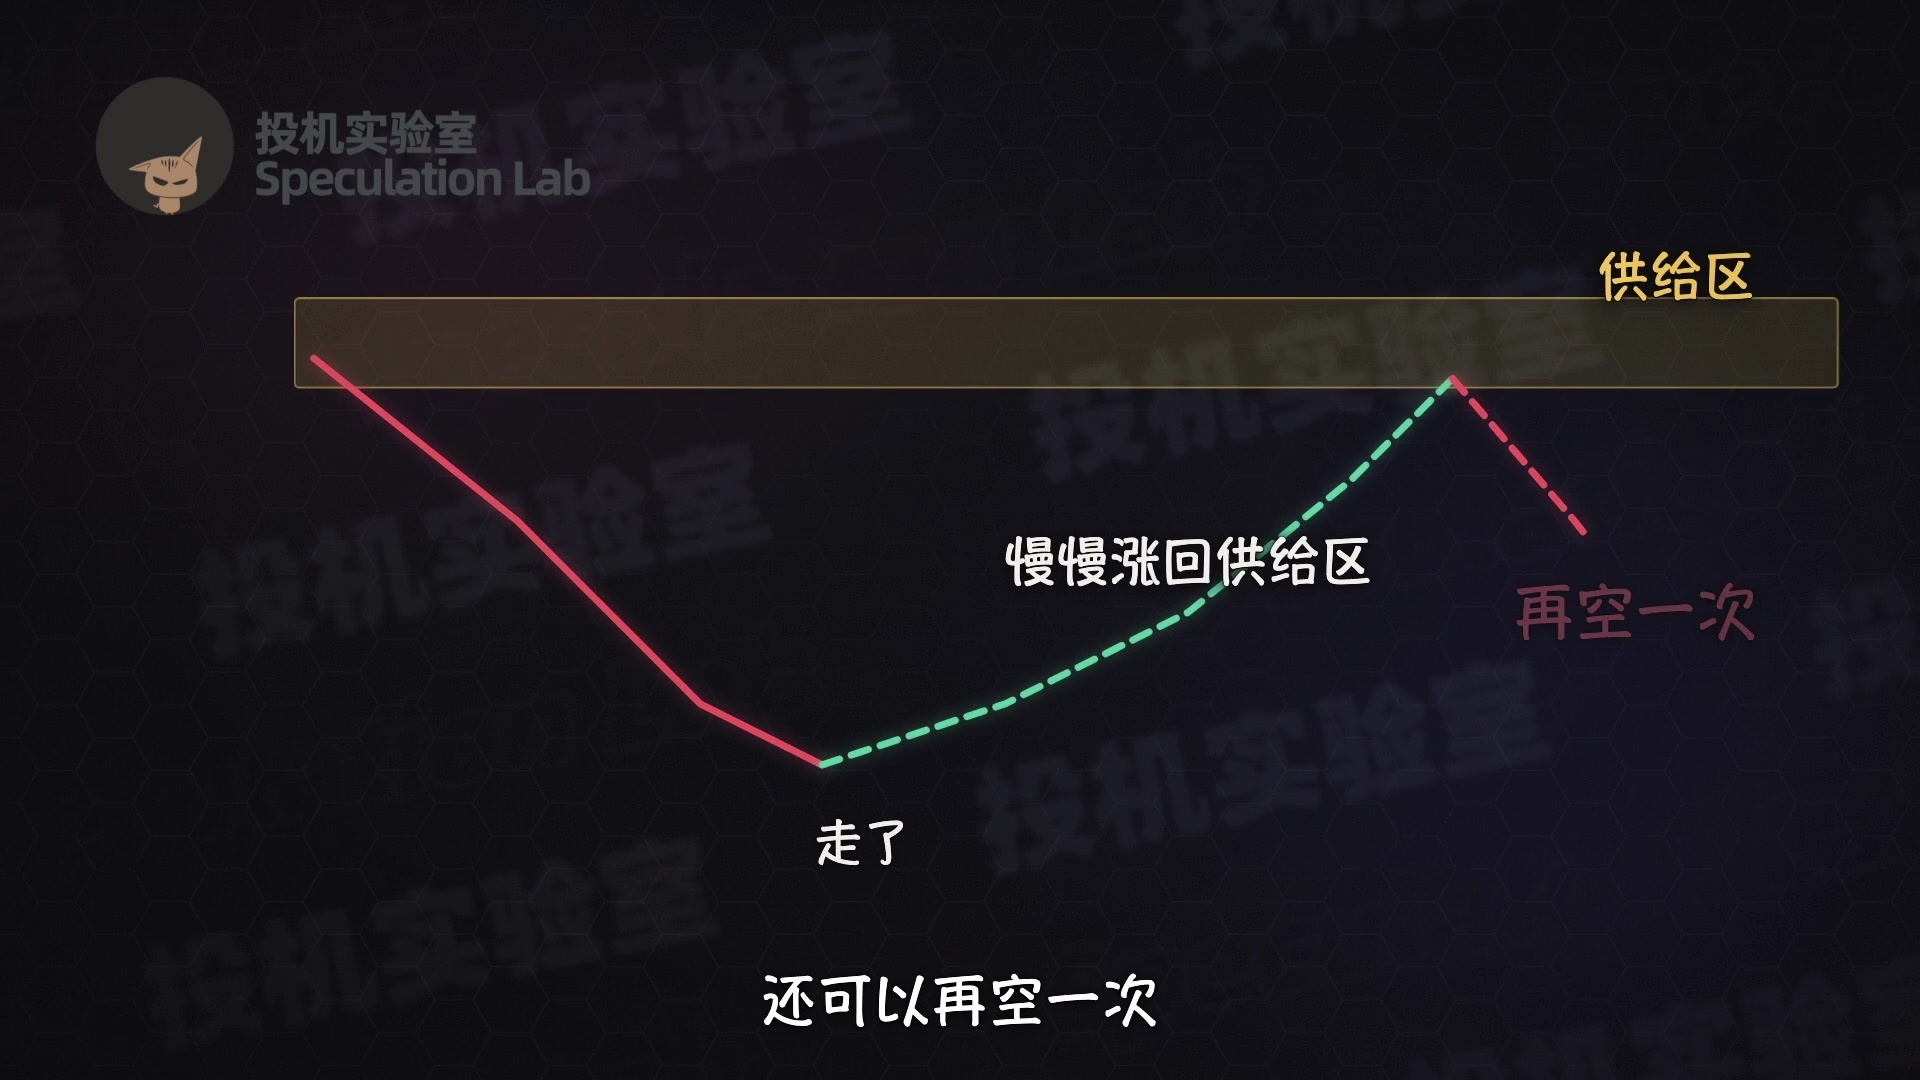
If the price plunges in several large bearish candles in a row, close most of the position first. After such a sharp drop, the price will probably move sideways for a while. Once it stabilizes and buyers start stepping in, close the rest. Don't try to guess where the bottom is.
After getting out, if the price slowly climbs back to that supply zone, you can short it again.
He measures how much he's willing to risk on each trade in dollars. A typical trade for him is $30,000 to $50,000. He advises beginners to risk no more than one percent of their account on each trade, and just 0.5 percent when starting out.
For example, with a $1,000 account, you can lose no more than $5 to $10 on a trade. At this stage, a beginner's goal isn't to make money; it's to stay in the market even after getting it wrong many times.
To figure out how many shares you can buy, divide the amount you're willing to lose by the distance between your entry price and your stop-loss. For example, if you can only lose $10 and your entry price is $1 above your stop-loss, you can buy only ten shares.

Beginners should make no more than three trades a day. If you have limited funds for futures, you can start with micro contracts, which are only one-tenth the size of standard contracts.
He also has a few rules specifically designed to keep himself in check.
After a trade, whether you win or lose, he recommends not placing another order for at least ten minutes. People are most emotional right after they exit. If they've just lost, they might feel like losing another $300 or $500 doesn't matter.
One trade after another, and you can lose a lot in a single day.

If you make a bad trade by breaking your rules, reduce your risk on the second trade or call it a day. After two such trades, step away from the computer. If you make a big profit right after the open, reduce your position size on the second trade.
He's made this mistake many times: making a big profit at the open, taking a bigger position on the second trade, and giving it all back.
Don't add to a losing position.
Before adding to a position, ask yourself: If I didn't already have this trade on, would I buy here now? If the answer is no, don't add.

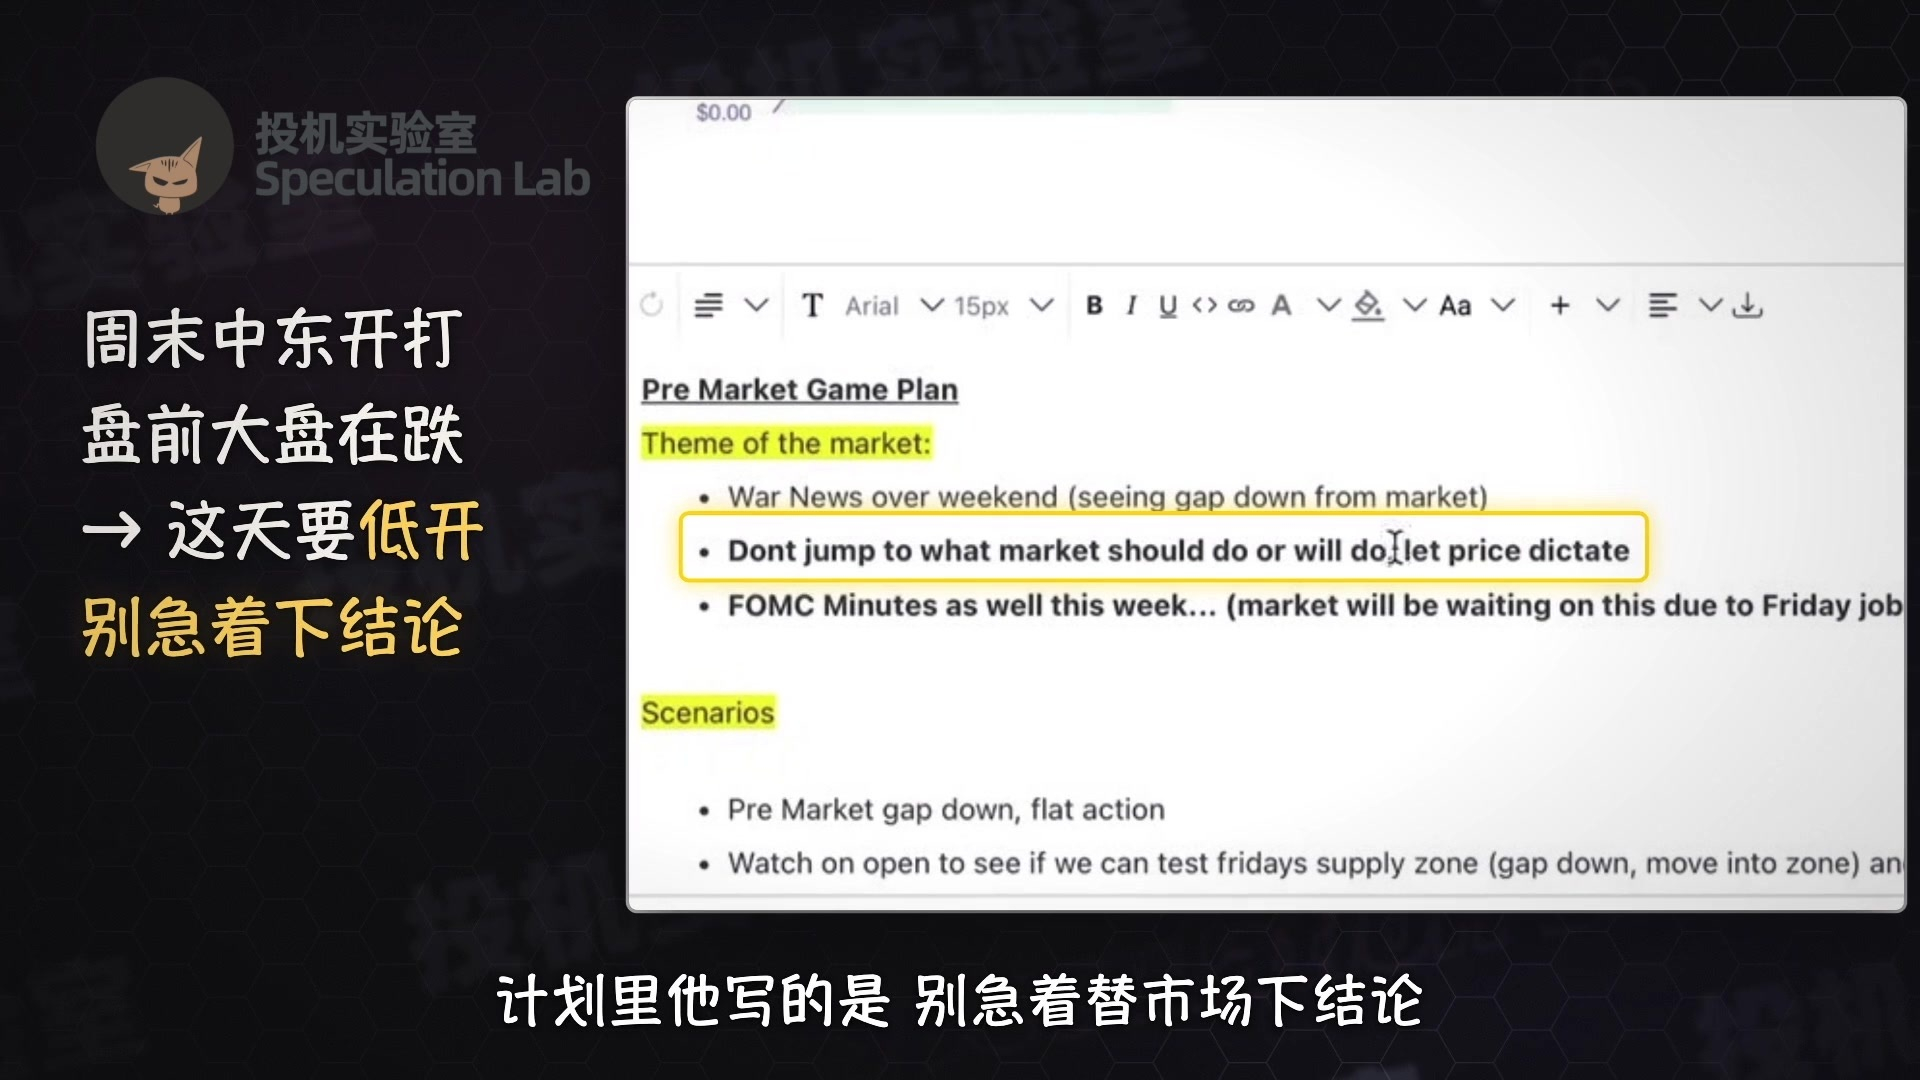
Let's look at an example: Monday, October 9, 2023. Fighting broke out in the Middle East over the weekend, and the broader market was already falling before the open, so he knew it would gap down that day.
His plan said: Don't rush to make up your mind about the market. Let the price speak for itself.
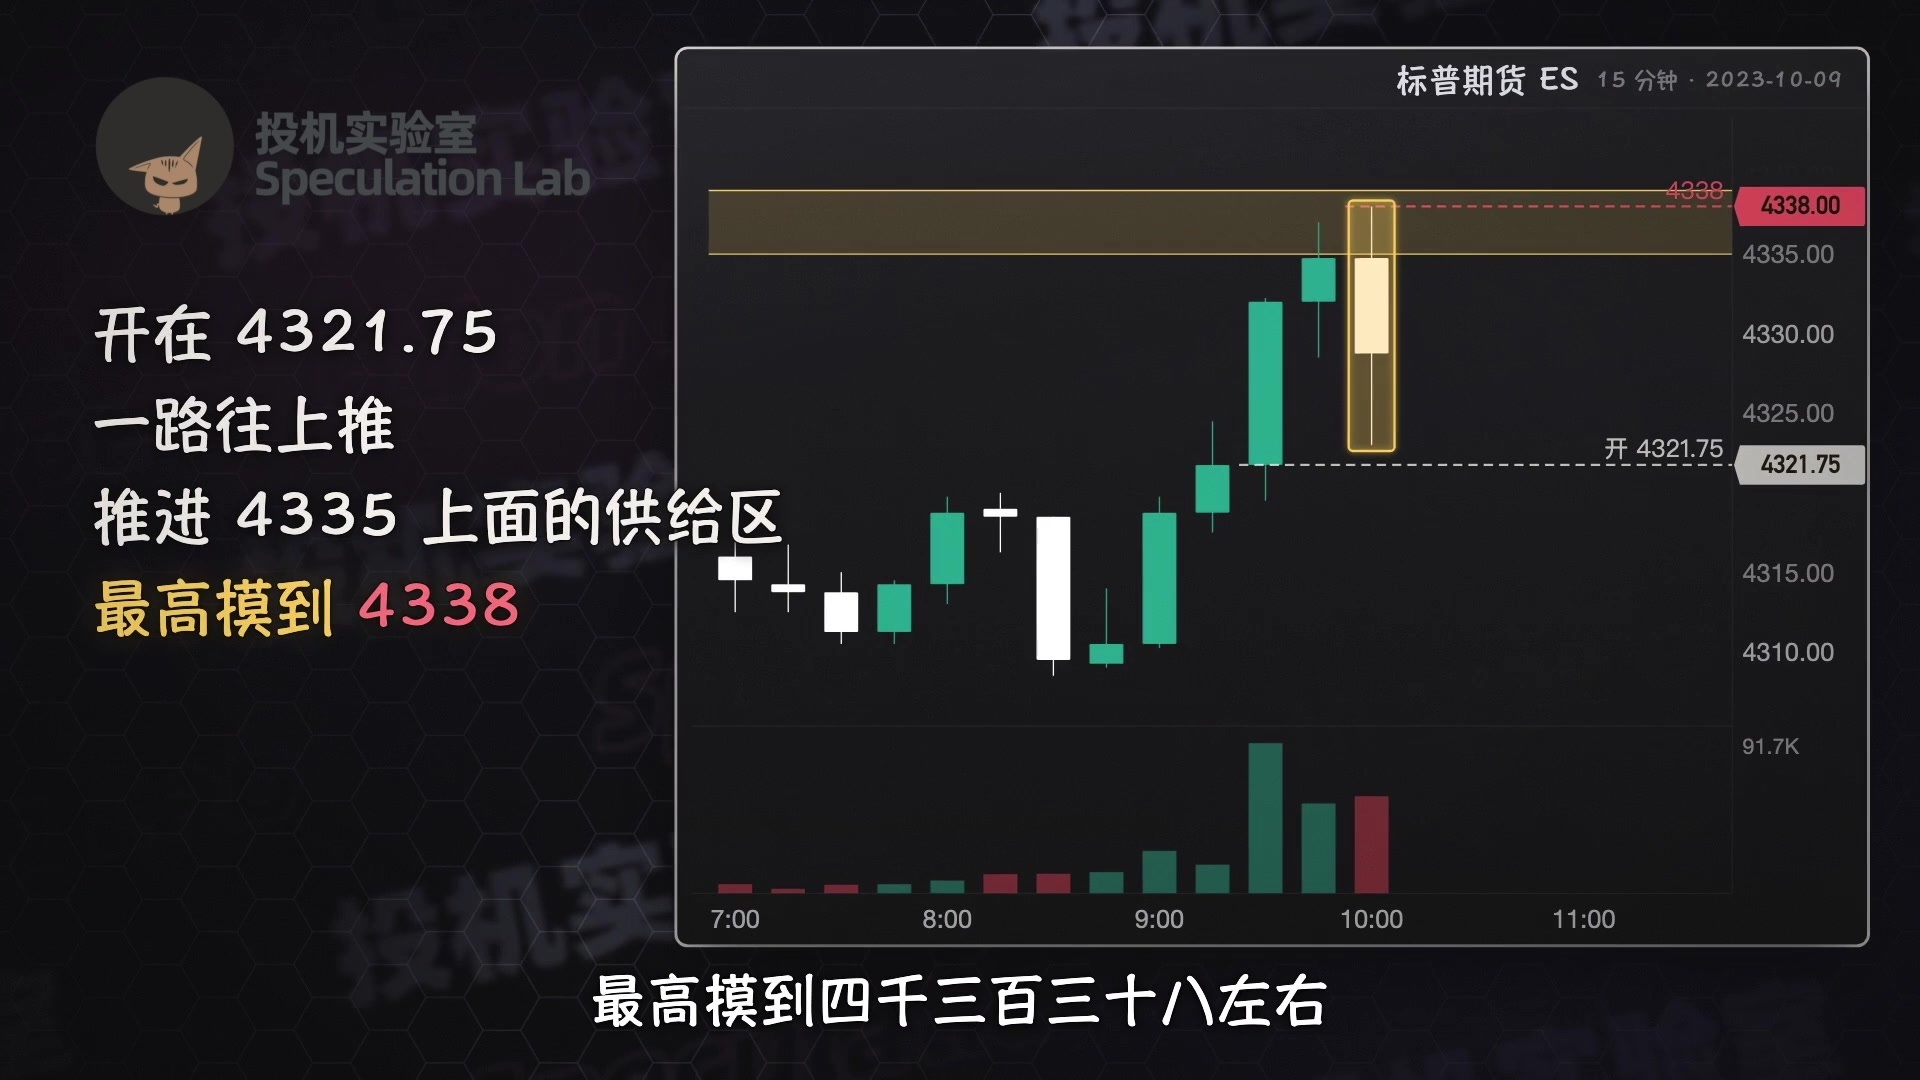
He marked a key level at a supply zone left by the previous Friday, around 4,335 on S&P futures. In the days before, the price had turned down whenever it touched this area.
The plan was to see whether the price could rally back to this supply zone after gapping down, then look for a shorting opportunity there.
At 9:30, SPY opened at $427.58, below the previous day's close of $429.54—a gap down. But it opened within Friday's trading range, which he said wasn't ideal.
S&P futures opened at 4,321.75 and climbed steadily after the open. Around 10, they moved into the supply zone above 4,335 and reached a high of about 4,338.
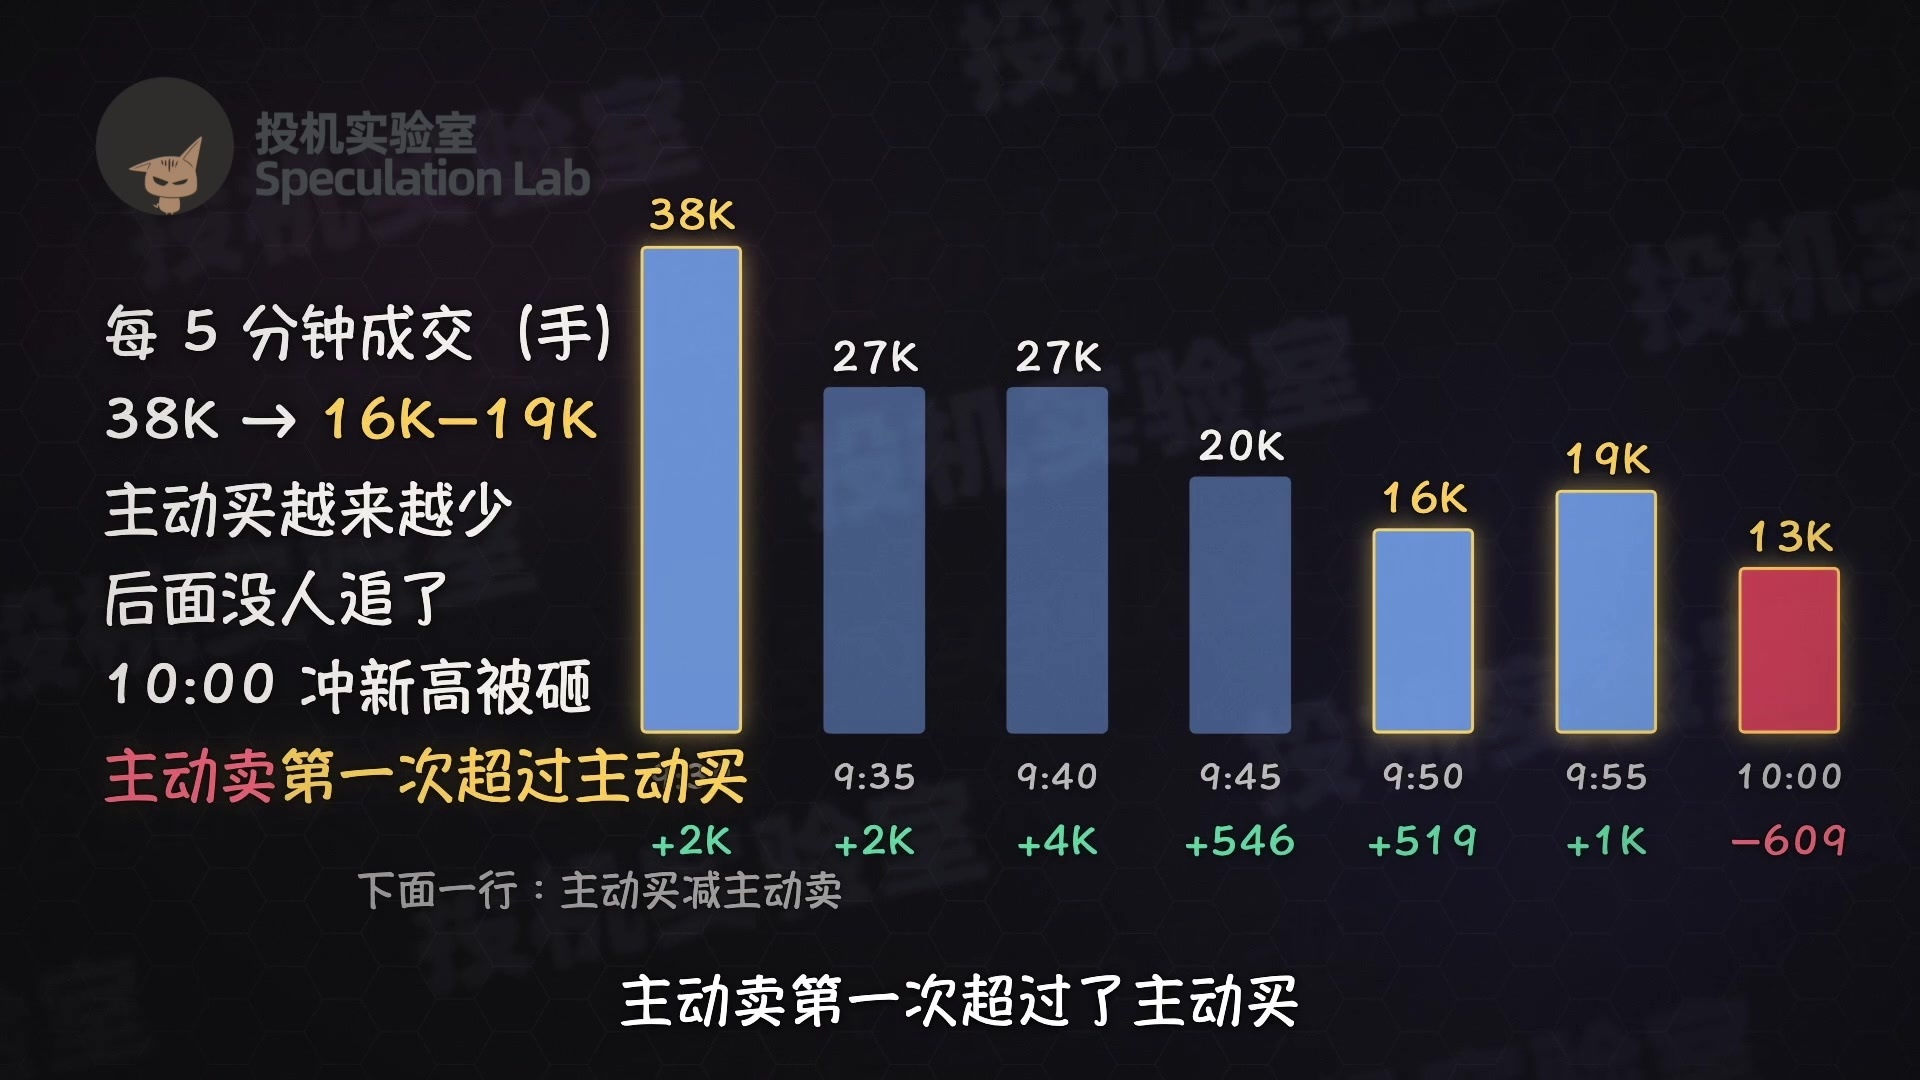
But during that half-hour climb, the number of contracts traded every five minutes fell from 38,000 to between 16,000 and 19,000. There were also fewer and fewer aggressive buy orders. The price was rising, but no one was chasing it.
After the 10 a.m. candle made a new high, it was immediately knocked back down. For the first time, aggressive selling exceeded aggressive buying.
At 10:02, he bought 400 SPY puts expiring that day, betting that the price would fall.
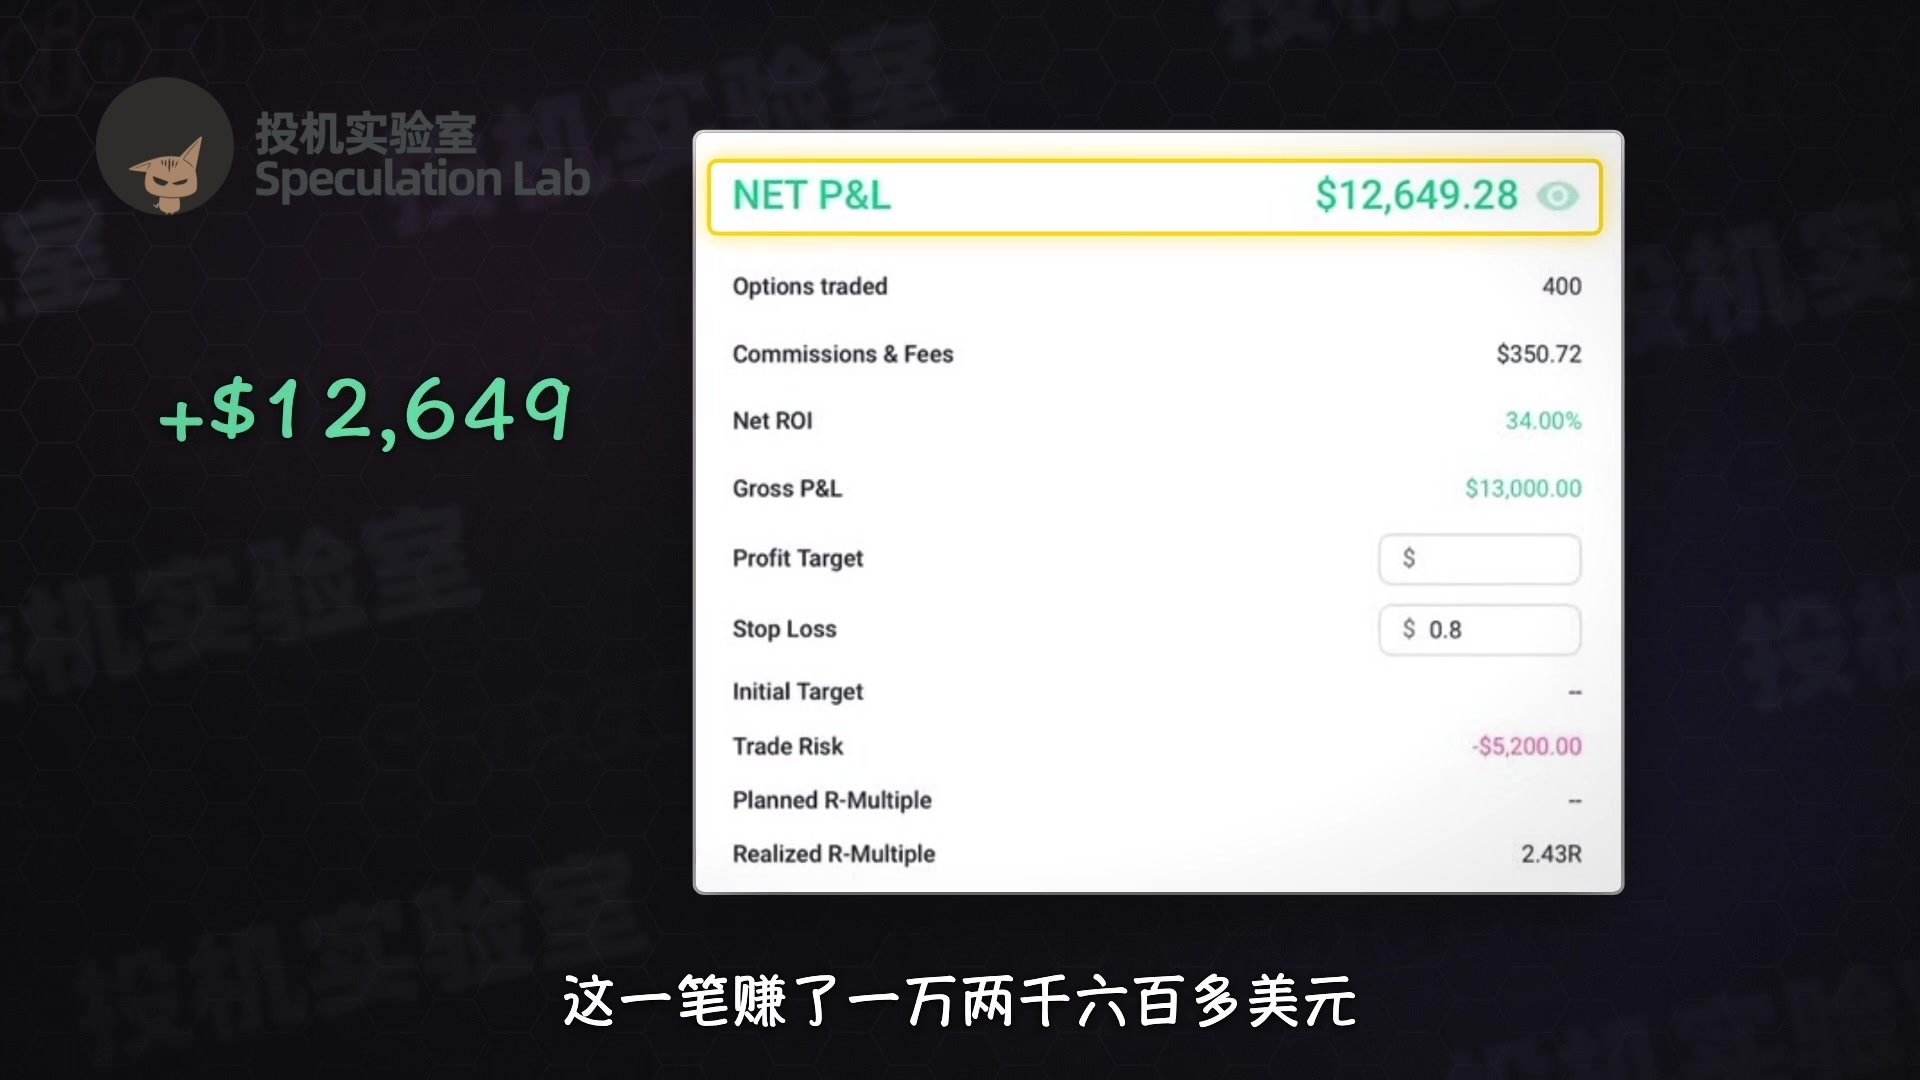
He placed his stop-loss above the point where S&P futures would get back above 4,335. Based on the options price, he could lose no more than $5,200.
The price then plunged in three large bearish candles in a row, falling to around the opening price. At 10:04, he closed 70 percent of his position.
At 10:08, the price stabilized and buyers started stepping in, so he closed the rest. He made more than $12,600 on the trade, about two and a half times his risk.
After 10:20, the price slowly climbed back to 4,335. Volume continued to decline during the move, and no one was chasing it. At 10:27, he shorted again at the same level.
By then, it had been almost an hour since the open. He cut his position from 400 contracts to 300, with $2,700 at risk. He closed the trade at 10:37, making another $8,000-plus—exactly three times his risk.
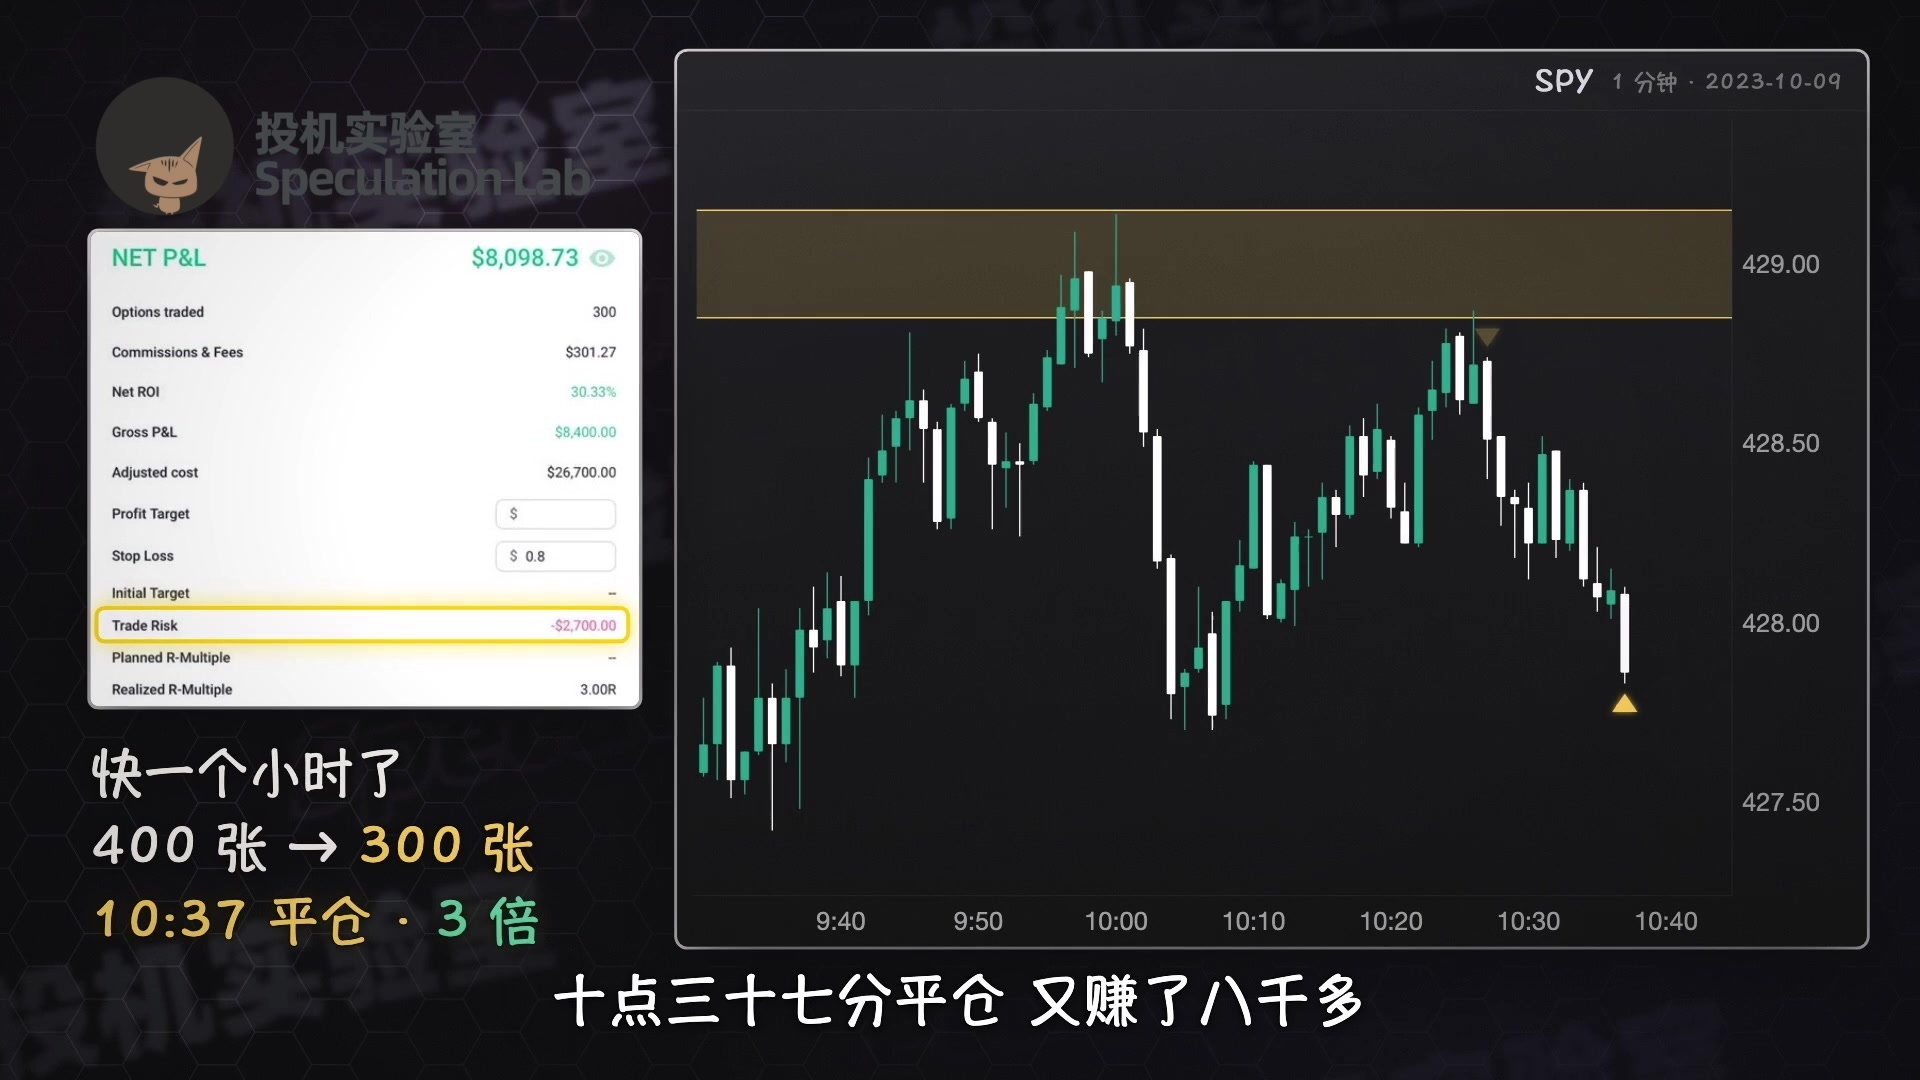
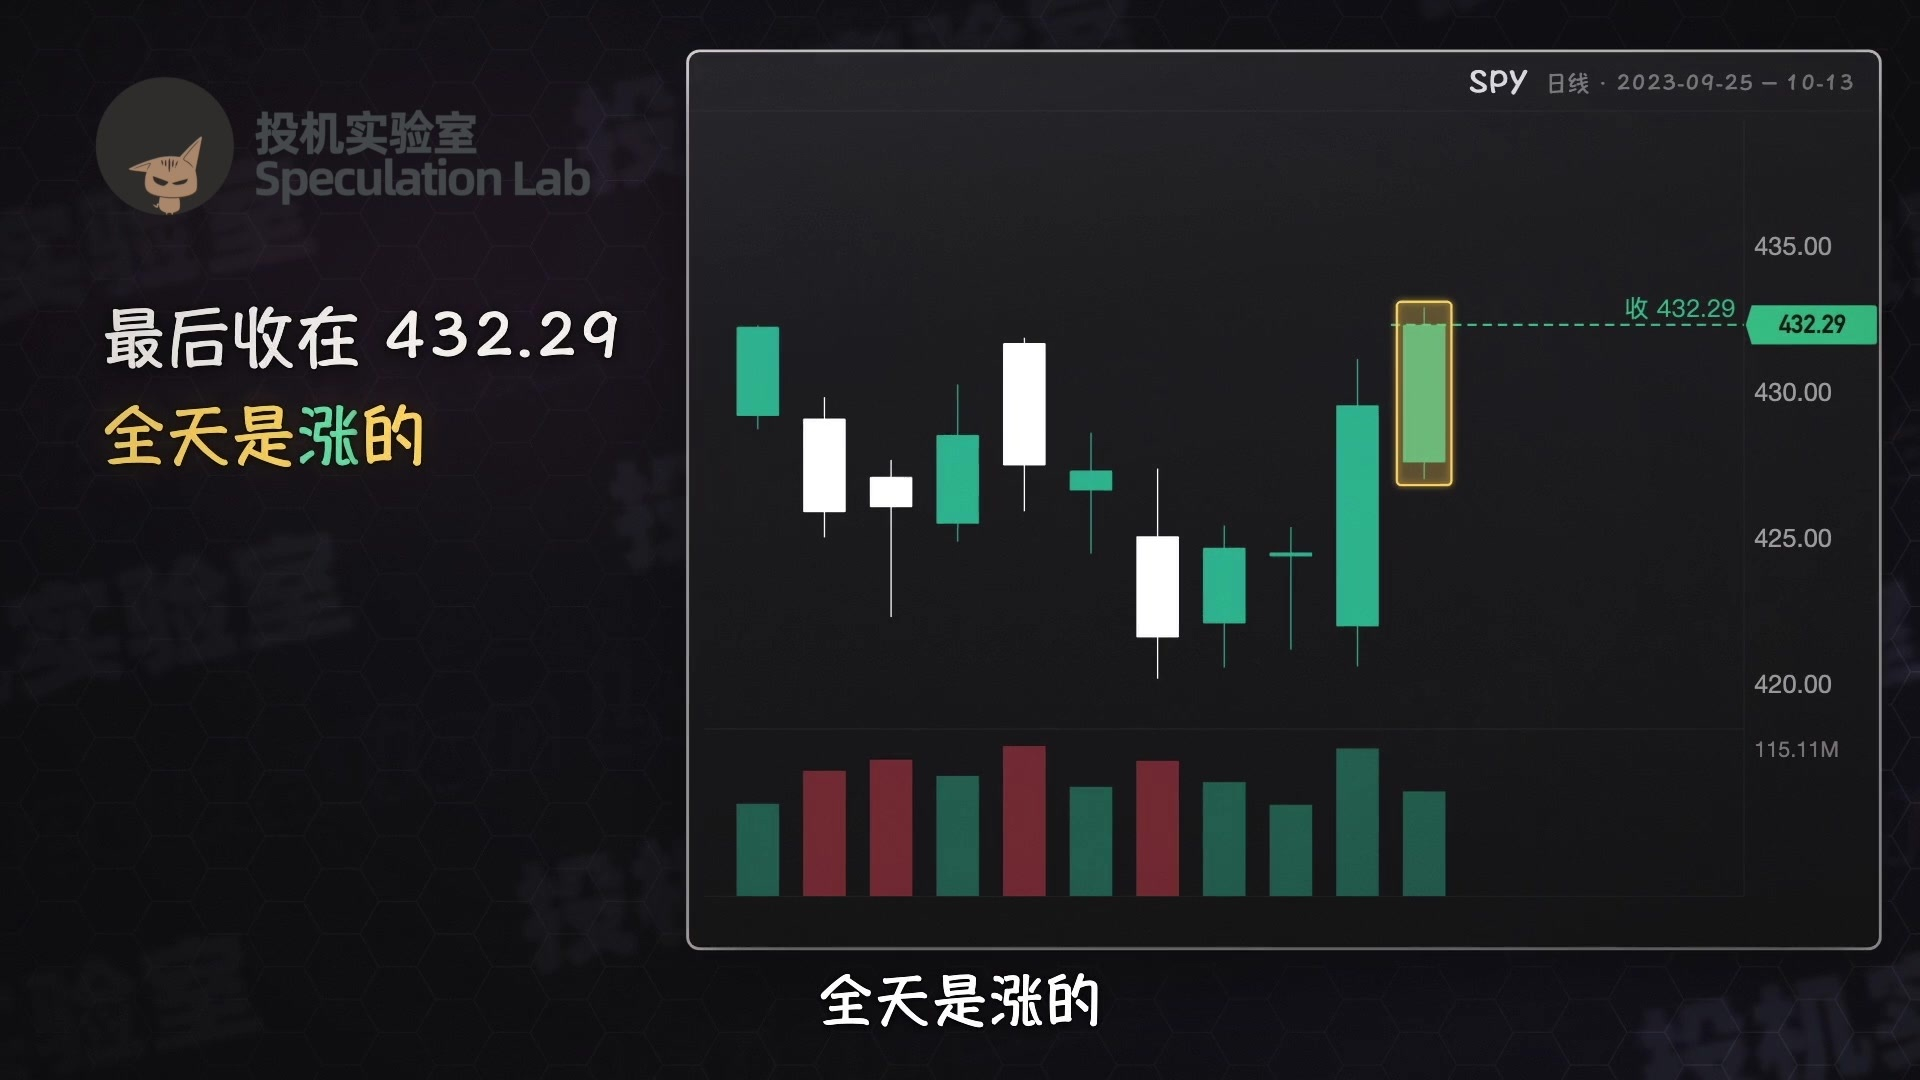
SPY ended the day at $432.29, up on the day. He traded only during that first hour after the open and made just over $20,000 on two trades.
And that's Umar's entire early-session top reversal strategy, laid out for you. This is an entertainment show, not investment advice. Check whether you've clicked the subscribe button. Good morning, good afternoon, and good night. Bye!