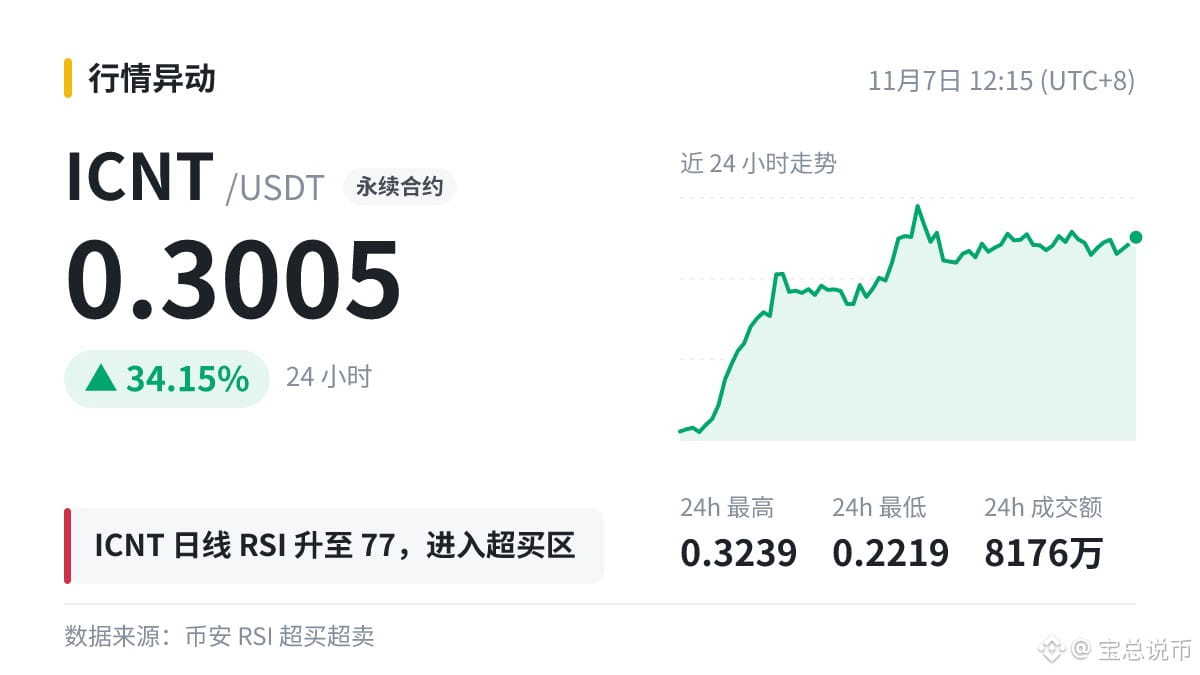
🧮 Latest data: $ICNT |Daily RSI(14) 76.8|Overbought
· Explanation: The 14 in RSI(14) means 14 candlesticks: on a 4-hour chart, that covers a little over two days (56 hours); on a daily chart, it means exactly two weeks.
· How to read it: RSI is calculated from past prices and reflects the pace of movements that have already happened. It cannot tell you what will happen next.
Don't change your original pace based on a single number, and don't use borrowed money to test a judgment.
In highly volatile markets, risk management comes first.
· Explanation: The 14 in RSI(14) means 14 candlesticks: on a 4-hour chart, that covers a little over two days (56 hours); on a daily chart, it means exactly two weeks.
· How to read it: RSI is calculated from past prices and reflects the pace of movements that have already happened. It cannot tell you what will happen next.
Don't change your original pace based on a single number, and don't use borrowed money to test a judgment.
In highly volatile markets, risk management comes first.