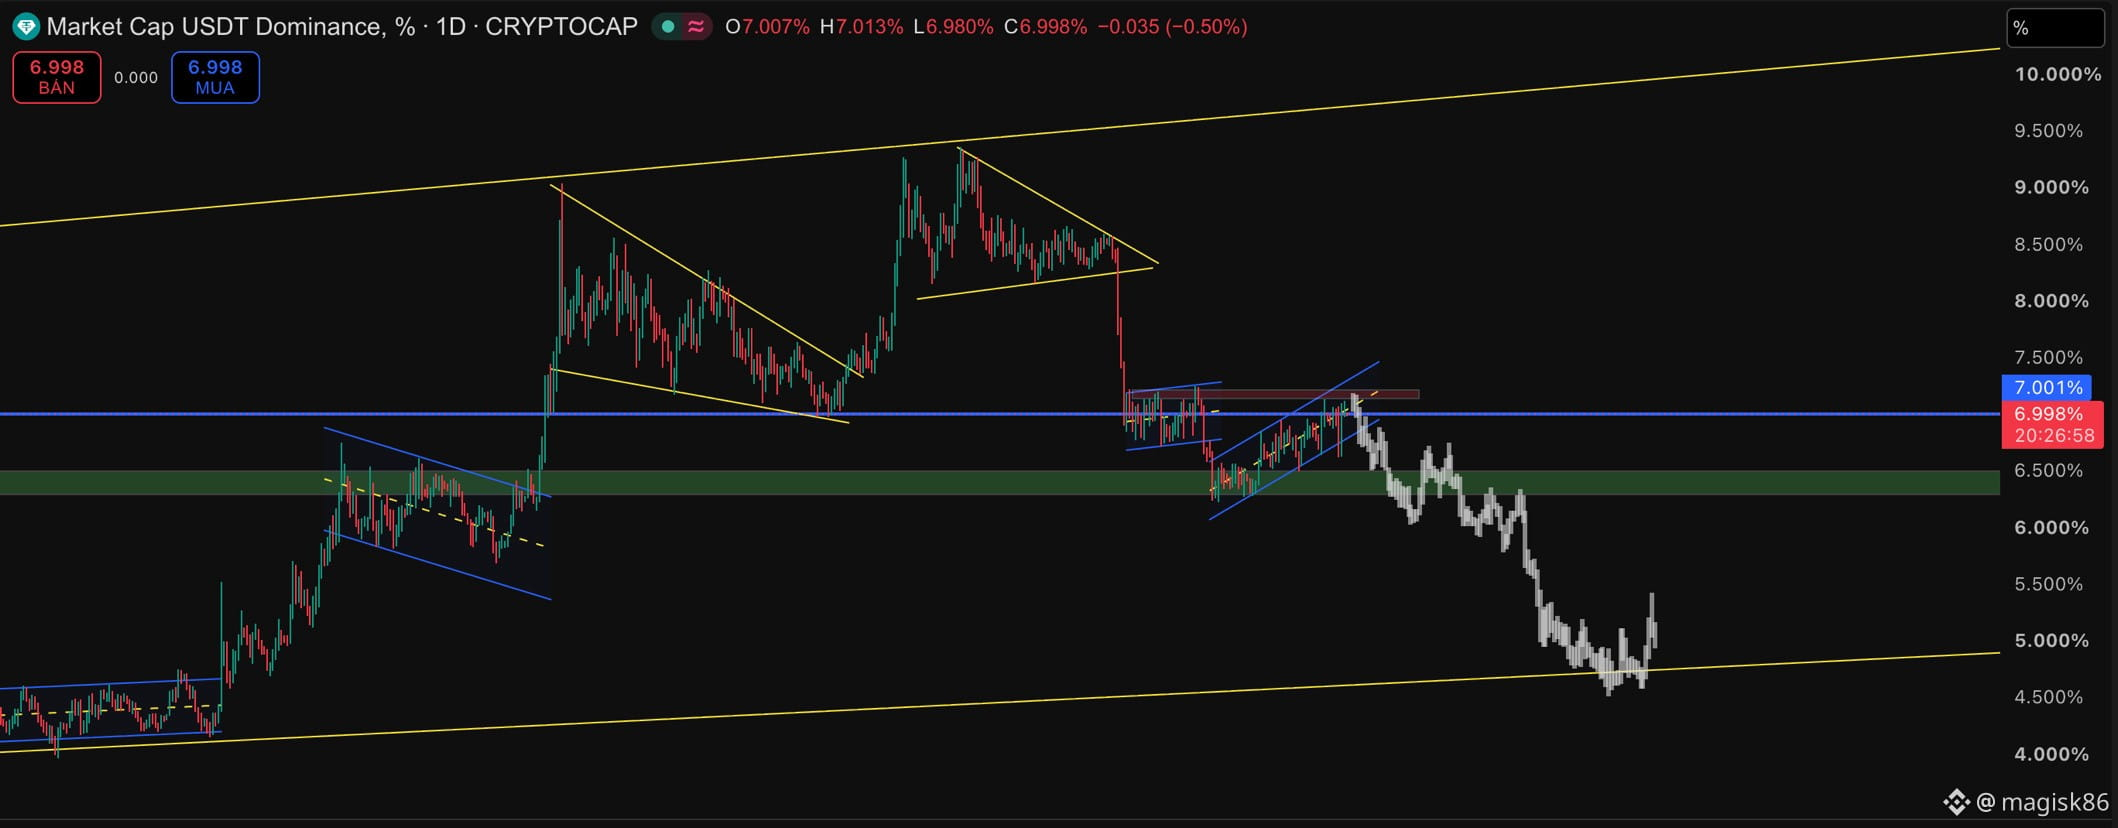
📊 Scenario to watch: USDT.D could continue to decline.
On the daily chart, USDT.D is moving within a short-term ascending price channel around the 7% level. If it breaks below this channel—confirmed by a candle closing beneath it—the 6.5% area will become a notable support level; further down is the lower boundary of the long-term price channel.
Weakness in USDT.D could indicate that capital is shifting out of stablecoins and back into the broader cryptocurrency market, creating a favorable environment for BTC and altcoins. This is a scenario that requires confirmation, rather than a sure signal.
Watch how price reacts at key support and resistance zones.📈📉$BTC
On the daily chart, USDT.D is moving within a short-term ascending price channel around the 7% level. If it breaks below this channel—confirmed by a candle closing beneath it—the 6.5% area will become a notable support level; further down is the lower boundary of the long-term price channel.
Weakness in USDT.D could indicate that capital is shifting out of stablecoins and back into the broader cryptocurrency market, creating a favorable environment for BTC and altcoins. This is a scenario that requires confirmation, rather than a sure signal.
Watch how price reacts at key support and resistance zones.📈📉$BTC