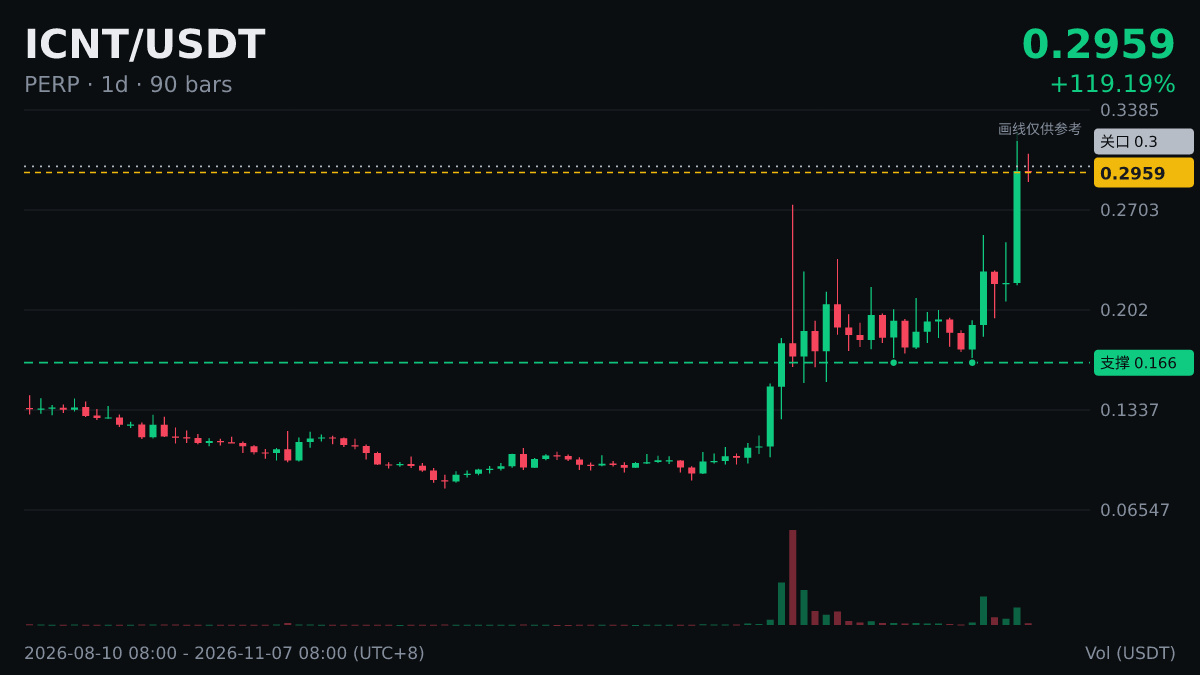
Relax, let me explain: $ICNT — the daily RSI is 75.8, which is in overbought territory.
RSI 75.8, and my heart rate is rising right along with it.
Jokes aside, the 14 in RSI means 14 candlesticks: on a 4-hour chart, that covers a little over two days (56 hours); on a daily chart, it covers exactly two weeks.
Indicators can fail, but stop-losses shouldn’t be skipped: deciding in advance what to do if you’re wrong matters more than guessing correctly.
RSI 75.8, and my heart rate is rising right along with it.
Jokes aside, the 14 in RSI means 14 candlesticks: on a 4-hour chart, that covers a little over two days (56 hours); on a daily chart, it covers exactly two weeks.
Indicators can fail, but stop-losses shouldn’t be skipped: deciding in advance what to do if you’re wrong matters more than guessing correctly.