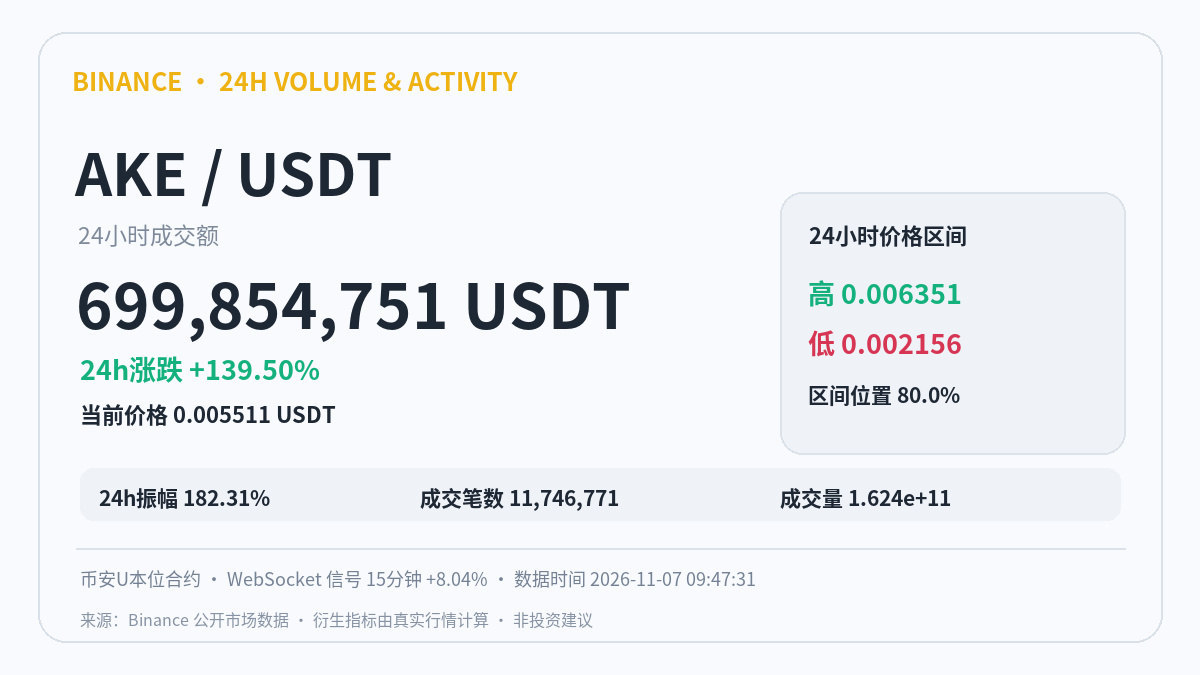
For $AKE , I want to first look for evidence that would invalidate the current directional view.
$AKE | Up 8.04% over 15 minutes | Recorded price: 0.005508 USDT. Market data timestamp: 2026-11-07 09:47:31. Cumulative 24-hour trading volume: 700 million USDT.
More data from the next interval is needed to confirm that this move is valid. The 24-hour trading volume is a rolling cumulative figure, so it cannot show how much new trading occurred in the last few minutes.
Countercheck: If the price quickly falls back below the recorded price, I would first reassess this rally as a spike followed by a pullback.
What would support a continuation? If the next 15-minute candlestick remains above the recorded price of 0.005508 USDT, I’ll continue to watch whether actual trading volume over the same period confirms the move. Only new data can increase confidence in this assessment.
Data review: The notional value of open positions changed by +4.43% over the adjacent 5-minute interval (including the effect of price-based valuation); the current estimated funding rate is +0.0050% (unsettled); the long/short account ratio is 1.107 (this is not the amount of aggressive buying or selling).
Risk: Short-term volatility, liquidity, and slippage risks may be amplified. This is a conditional analysis based on public data, not a trading instruction.
$AKE | Up 8.04% over 15 minutes | Recorded price: 0.005508 USDT. Market data timestamp: 2026-11-07 09:47:31. Cumulative 24-hour trading volume: 700 million USDT.
More data from the next interval is needed to confirm that this move is valid. The 24-hour trading volume is a rolling cumulative figure, so it cannot show how much new trading occurred in the last few minutes.
Countercheck: If the price quickly falls back below the recorded price, I would first reassess this rally as a spike followed by a pullback.
What would support a continuation? If the next 15-minute candlestick remains above the recorded price of 0.005508 USDT, I’ll continue to watch whether actual trading volume over the same period confirms the move. Only new data can increase confidence in this assessment.
Data review: The notional value of open positions changed by +4.43% over the adjacent 5-minute interval (including the effect of price-based valuation); the current estimated funding rate is +0.0050% (unsettled); the long/short account ratio is 1.107 (this is not the amount of aggressive buying or selling).
Risk: Short-term volatility, liquidity, and slippage risks may be amplified. This is a conditional analysis based on public data, not a trading instruction.