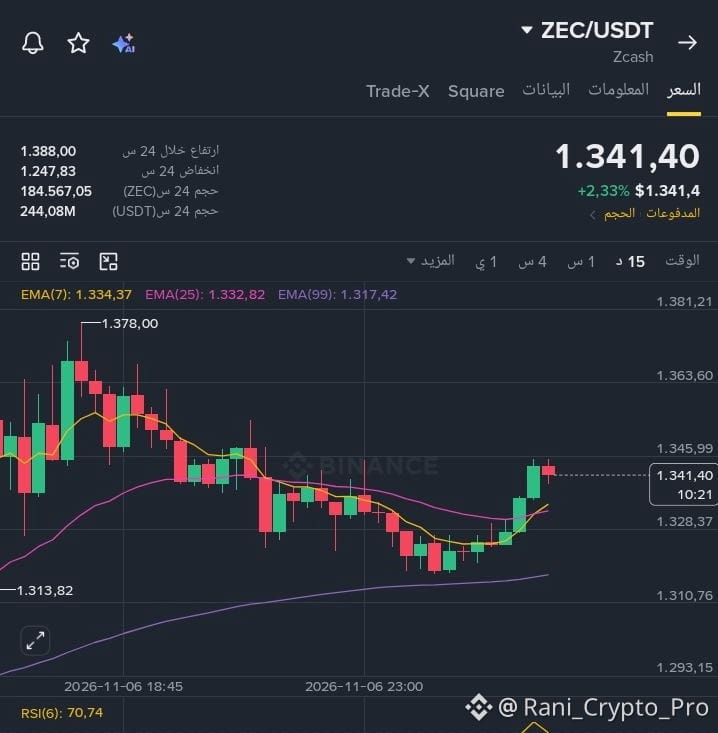
🚨 $ZEC faces an important technical test… The 1,348–1,358 zone separates continued movement from a possible correction!
ZECUSDT perpetual analysis on the 5-minute and 4-hour timeframes; all levels are in USDT.
🎯 Key resistance:
Bollinger, Fibonacci, and volume-weighted average price levels converge between 1,348 and 1,358, making this a resistance zone worth watching.
A 4-hour candle close above 1,358, followed by a successful retest of the zone, strengthens the scenario for an extension toward 1,369, then 1,408–1,419. These targets depend on breakout confirmation and are not guaranteed outcomes.
🛡️ Support zones:
On the shorter timeframe, support is clustered between 1,318 and 1,324, then 1,314–1,316, followed by 1,309–1,310.
A break below 1,318 without reclaiming it weakens the short-term rebound scenario. On the 4-hour timeframe, broader support zones appear at 1,228–1,236, then 1,207–1,208; these are relatively distant and are not automatic targets for every pullback.
⚠️ Where does the breakout trap lie?
Briefly moving above resistance and then falling back below it is not enough to confirm a rise. Stronger confirmation would be holding above the zone and turning it from resistance into support.
Also, a rebound on the 5-minute timeframe alone does not confirm an upward trend on the 4-hour timeframe; avoid confusing short-term speculative movement with the broader trend.
This analysis is based on technical levels, not confirmation from RSI or MACD. Risk management comes first, and this post is not investment advice.
ZECUSDT perpetual analysis on the 5-minute and 4-hour timeframes; all levels are in USDT.
🎯 Key resistance:
Bollinger, Fibonacci, and volume-weighted average price levels converge between 1,348 and 1,358, making this a resistance zone worth watching.
A 4-hour candle close above 1,358, followed by a successful retest of the zone, strengthens the scenario for an extension toward 1,369, then 1,408–1,419. These targets depend on breakout confirmation and are not guaranteed outcomes.
🛡️ Support zones:
On the shorter timeframe, support is clustered between 1,318 and 1,324, then 1,314–1,316, followed by 1,309–1,310.
A break below 1,318 without reclaiming it weakens the short-term rebound scenario. On the 4-hour timeframe, broader support zones appear at 1,228–1,236, then 1,207–1,208; these are relatively distant and are not automatic targets for every pullback.
⚠️ Where does the breakout trap lie?
Briefly moving above resistance and then falling back below it is not enough to confirm a rise. Stronger confirmation would be holding above the zone and turning it from resistance into support.
Also, a rebound on the 5-minute timeframe alone does not confirm an upward trend on the 4-hour timeframe; avoid confusing short-term speculative movement with the broader trend.
This analysis is based on technical levels, not confirmation from RSI or MACD. Risk management comes first, and this post is not investment advice.