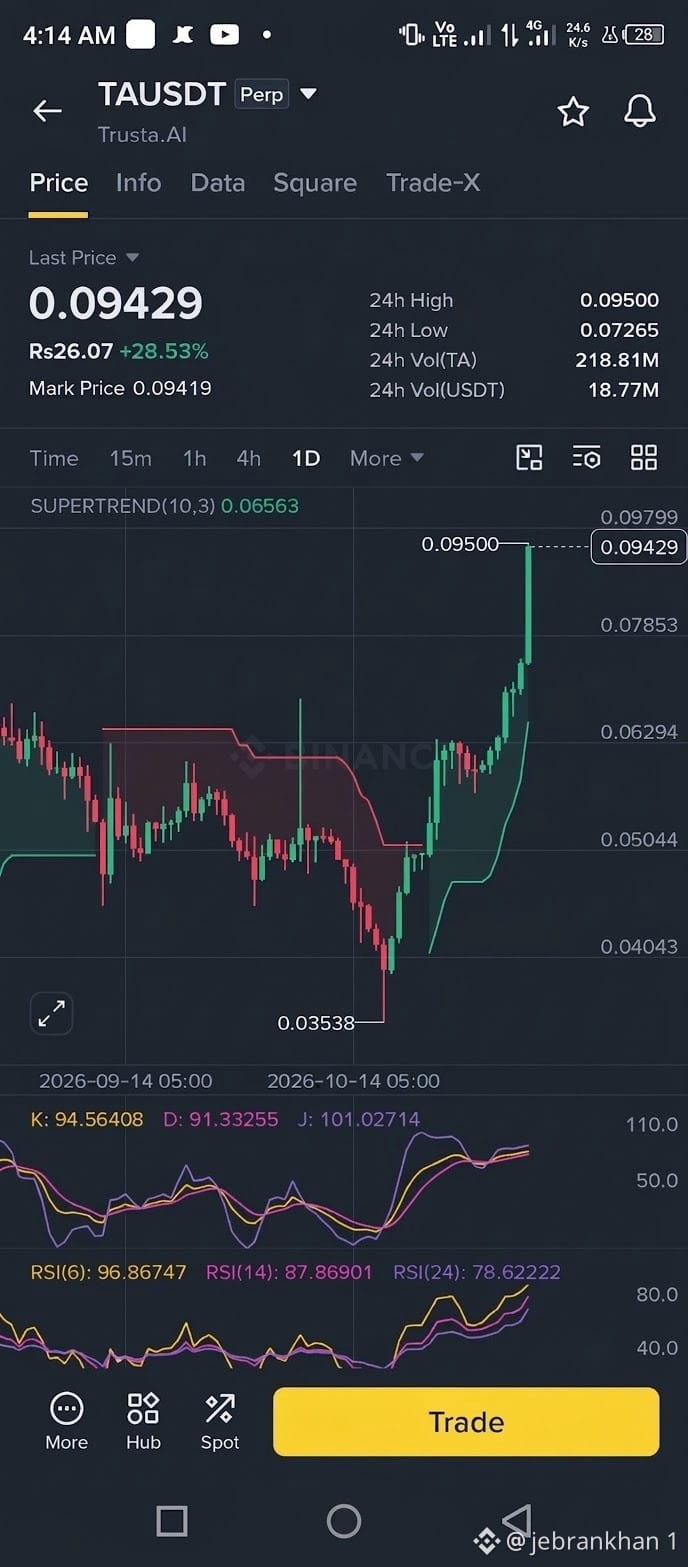
$TA Short trade signal 🤑TA/USDT (Trusta.AI) is showing a massive 28.53% bullish pump on the 1-day chart. The price is trading at 0.09429, having reached a 24-hour high of 0.09500.
Key technical observations:
Trend & Momentum: Supertrend (10,3) has entered the green zone (level 0.06563). A strong green breakout candle has breached the previous resistance zone.
Overbought Warning (Indicators):
KDJ Indicator: The K line is at 94.56, the D line at 91.33, and the J line at 101.02.
RSI Indicators: The short-term RSI(6) has reached 96.86, and RSI(14) has reached 87.86.
.
Key Levels:
Resistance / Target: 0.09500 - 0.09800
Support Levels: 0.07850 and 0.06560 (Supertrend support)
)
Summary & Action:
Indicators are in an extremely overbought zone, making a top buy (FOMO) at this point potentially risky. If you are already in a trade, it would be better to trail your stop-loss to secure profits. Wait for a pullback before entering a new trade.
Key technical observations:
Trend & Momentum: Supertrend (10,3) has entered the green zone (level 0.06563). A strong green breakout candle has breached the previous resistance zone.
Overbought Warning (Indicators):
KDJ Indicator: The K line is at 94.56, the D line at 91.33, and the J line at 101.02.
RSI Indicators: The short-term RSI(6) has reached 96.86, and RSI(14) has reached 87.86.
.
Key Levels:
Resistance / Target: 0.09500 - 0.09800
Support Levels: 0.07850 and 0.06560 (Supertrend support)
)
Summary & Action:
Indicators are in an extremely overbought zone, making a top buy (FOMO) at this point potentially risky. If you are already in a trade, it would be better to trail your stop-loss to secure profits. Wait for a pullback before entering a new trade.