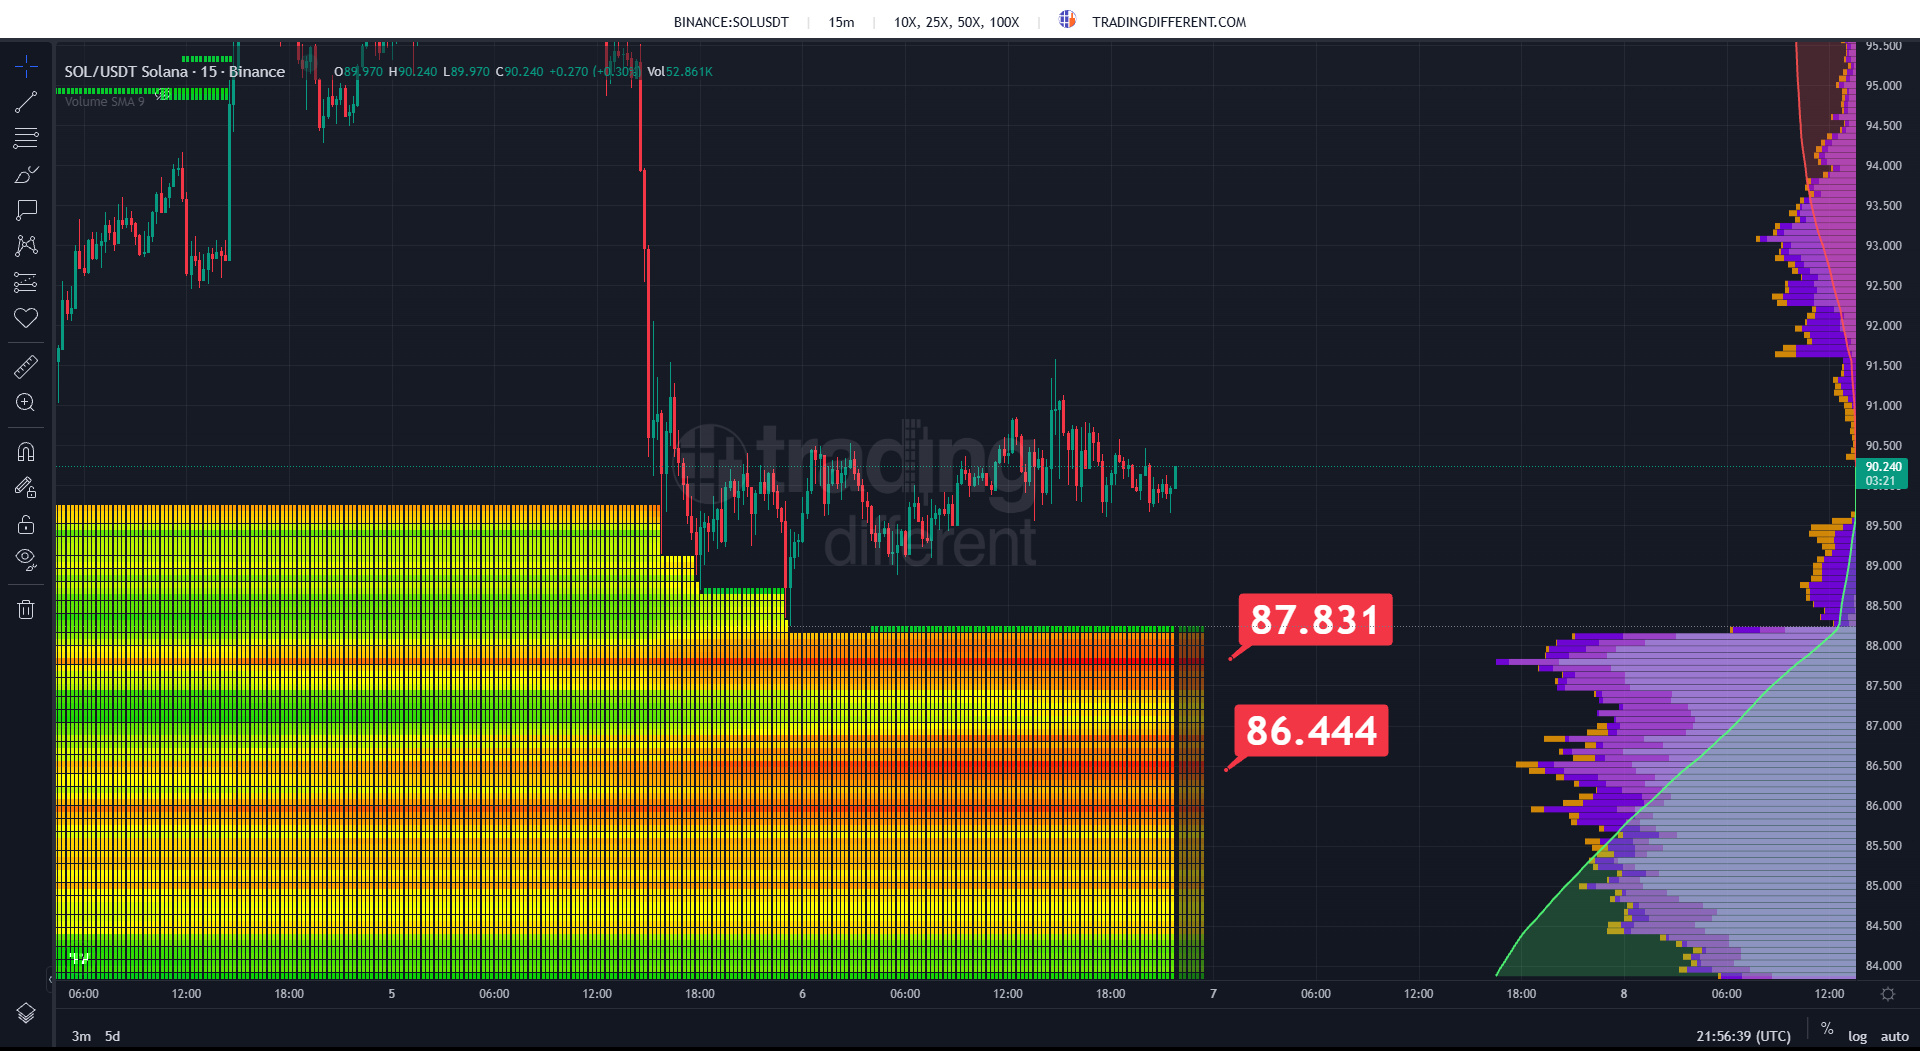
#sol | Solana 15m liquidation heatmap
Current price: 90,24
⚡ The drop on 5/11 reached ~88,3 and swept the upper part of the long block, between 88,3 and 89,7. Since then, SOL has bounced and is moving sideways between 89 and 91.
🟢 Exposed longs below:
84–88,2: the heaviest block on the entire map, starting just below the low. 87,831: first cluster, in red, at ~2,7% from the price. 86,444: second cluster, at ~4,2%.
🔴 Exposed shorts above:
There are no active bands near the price in the visible part of the map.
🔥 The price stalled right at the edge of the block and bounced, but most of the liquidity below remains intact.
The map does not indicate the direction of the price. It shows where leveraged positions would be liquidated if the price reaches those levels.
👉 tradingdifferent.com/es/dashboard/liquidation-heatmap?code=binance-square
Current price: 90,24
⚡ The drop on 5/11 reached ~88,3 and swept the upper part of the long block, between 88,3 and 89,7. Since then, SOL has bounced and is moving sideways between 89 and 91.
🟢 Exposed longs below:
84–88,2: the heaviest block on the entire map, starting just below the low. 87,831: first cluster, in red, at ~2,7% from the price. 86,444: second cluster, at ~4,2%.
🔴 Exposed shorts above:
There are no active bands near the price in the visible part of the map.
🔥 The price stalled right at the edge of the block and bounced, but most of the liquidity below remains intact.
The map does not indicate the direction of the price. It shows where leveraged positions would be liquidated if the price reaches those levels.
👉 tradingdifferent.com/es/dashboard/liquidation-heatmap?code=binance-square