🚀 $BTC /USDT: A moment of indecision or calm before the storm? ⚡️
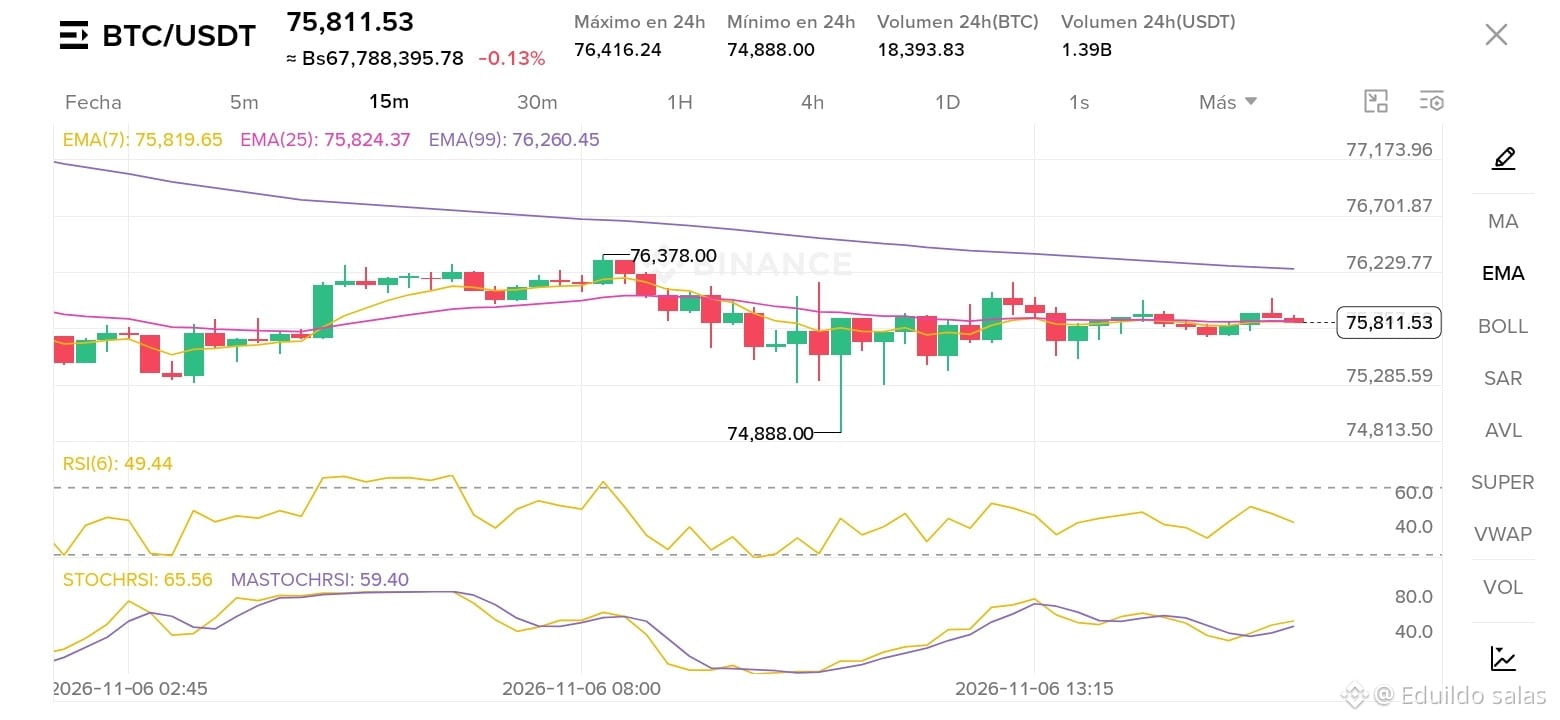
Taking a look at the 15-minute chart, Bitcoin is currently trading around $75,811.53, showing a slight move of -0.13%. The market has been moving in a narrow range over the past few hours, testing the boundaries of the moving averages (EMAs).
📊 Key market data (24h):
High: $76,416.24
Low: $74,888.00
Volume (BTC): 18,393.83
Volume (USDT): 1.39B
🔍 Quick technical analysis:
Crossed and compressed EMAs: The 7-period ($75,819.65) and 25-period ($75,824.37) EMAs are practically intertwined right around the current price, while the 99-period EMA remains slightly above ($76,260.45), acting as dynamic resistance. This reflects clear price consolidation and compression.
RSI (6) at 49.44: Deep in neutral territory, demonstrating a perfect balance between buying and selling pressure over this time frame.
StochRSI: At 65.56, with its average at 59.40, pointing to a slight short-term recovery bias, but without a clear trend taking shape yet.
💡 What to expect? We’re seeing a typical sideways-range scenario. A clean breakout above $76,000–$76,260 could spark bullish momentum toward the 24-hour high, while losing the current support zone could take us down to retest lower levels.
What’s your move for the next few hours? Are we breaking upward or continuing to consolidate? I’m reading your comments below! 👇📉📈
#BinanceSquare #BTCUSDT #BinancePick #EarningsSeason
Taking a look at the 15-minute chart, Bitcoin is currently trading around $75,811.53, showing a slight move of -0.13%. The market has been moving in a narrow range over the past few hours, testing the boundaries of the moving averages (EMAs).
📊 Key market data (24h):
High: $76,416.24
Low: $74,888.00
Volume (BTC): 18,393.83
Volume (USDT): 1.39B
🔍 Quick technical analysis:
Crossed and compressed EMAs: The 7-period ($75,819.65) and 25-period ($75,824.37) EMAs are practically intertwined right around the current price, while the 99-period EMA remains slightly above ($76,260.45), acting as dynamic resistance. This reflects clear price consolidation and compression.
RSI (6) at 49.44: Deep in neutral territory, demonstrating a perfect balance between buying and selling pressure over this time frame.
StochRSI: At 65.56, with its average at 59.40, pointing to a slight short-term recovery bias, but without a clear trend taking shape yet.
💡 What to expect? We’re seeing a typical sideways-range scenario. A clean breakout above $76,000–$76,260 could spark bullish momentum toward the 24-hour high, while losing the current support zone could take us down to retest lower levels.
What’s your move for the next few hours? Are we breaking upward or continuing to consolidate? I’m reading your comments below! 👇📉📈
#BinanceSquare #BTCUSDT #BinancePick #EarningsSeason