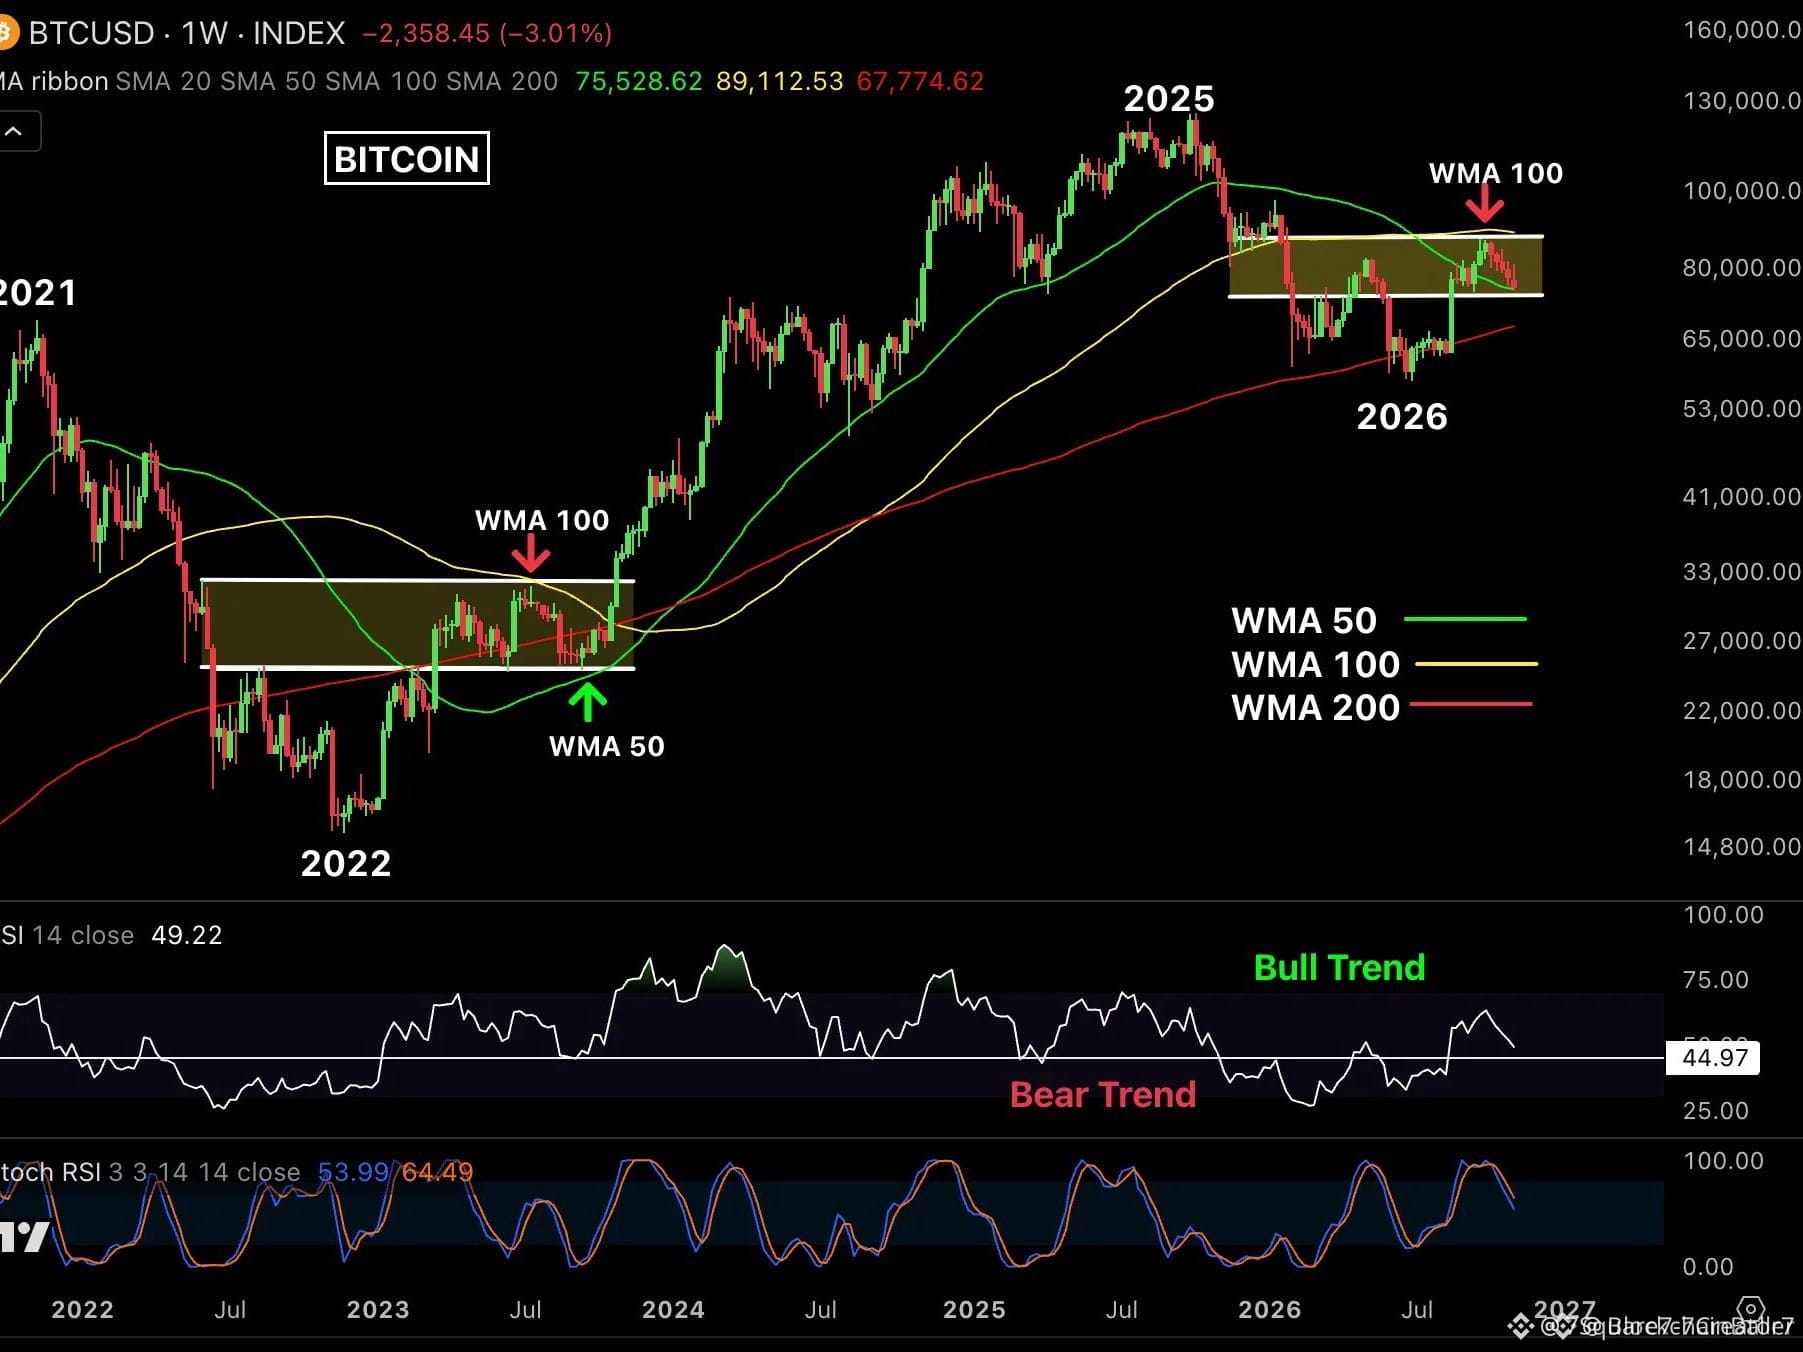
I see a pattern in Bitcoin similar to what happened in 2023....
Back then, $BTC
moved between the 50-week moving average and the 100-week moving average before breaking out of the range and starting a major rally.
Now, in 2026, I see the same setup again. Bitcoin was rejected near $87,400 (the 100-week moving average) and is still moving between these two averages.
Here’s what I’m watching:
* Support: $75,500 and $67,800.
* Resistance: $82,000 and $87,400.
* Relative Strength Index (RSI): Around 50, still showing some strength.
* Stochastic RSI: Looks weak, so I think BTC may dip a little further before rising.
I think the similarities to 2023 are worth watching.
If Bitcoin breaks above $87,400 and manages to stay above it, I think we could see another major rally.
But first, I want to see BTC hold its support level.
Back then, $BTC
moved between the 50-week moving average and the 100-week moving average before breaking out of the range and starting a major rally.
Now, in 2026, I see the same setup again. Bitcoin was rejected near $87,400 (the 100-week moving average) and is still moving between these two averages.
Here’s what I’m watching:
* Support: $75,500 and $67,800.
* Resistance: $82,000 and $87,400.
* Relative Strength Index (RSI): Around 50, still showing some strength.
* Stochastic RSI: Looks weak, so I think BTC may dip a little further before rising.
I think the similarities to 2023 are worth watching.
If Bitcoin breaks above $87,400 and manages to stay above it, I think we could see another major rally.
But first, I want to see BTC hold its support level.