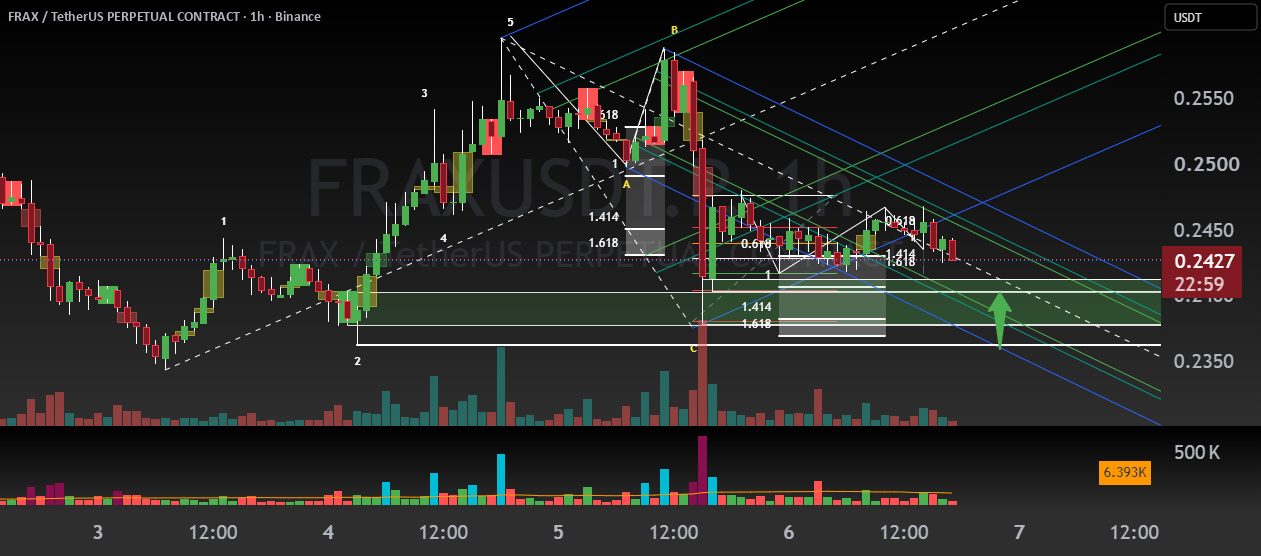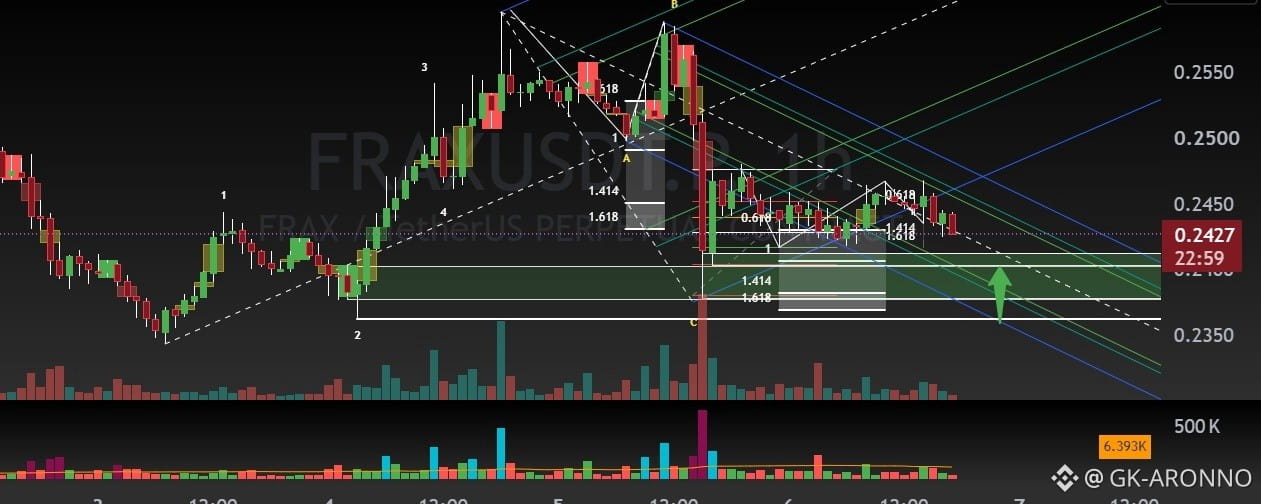


I’m buying this setup because the hourly chart appears to show a five-wave Elliott Wave advance, followed by the support area around 0.237–0.241.
My working idea is that the initial rise could be the first leg of a larger bullish move. The pullback reached the marked Fibonacci extension area, and price is now consolidating above that low.
I’m watching for a break above the descending corrective channel and the recent consolidation highs to strengthen the bullish case. The previous highs around 0.258–0.260 are a potential retest area if that breakout develops.
My entry is around 0.2436, with a stop at 0.2335. A fresh breakdown through support would weaken this interpretation.
This is a working wave count—the correction could still extend before a sustained recovery.