$BTC
Quick technical analysis of Bitcoin ($BTC )
Bitcoin is currently trading around $75,753, down slightly by 0.44% as it tests a critical support zone.
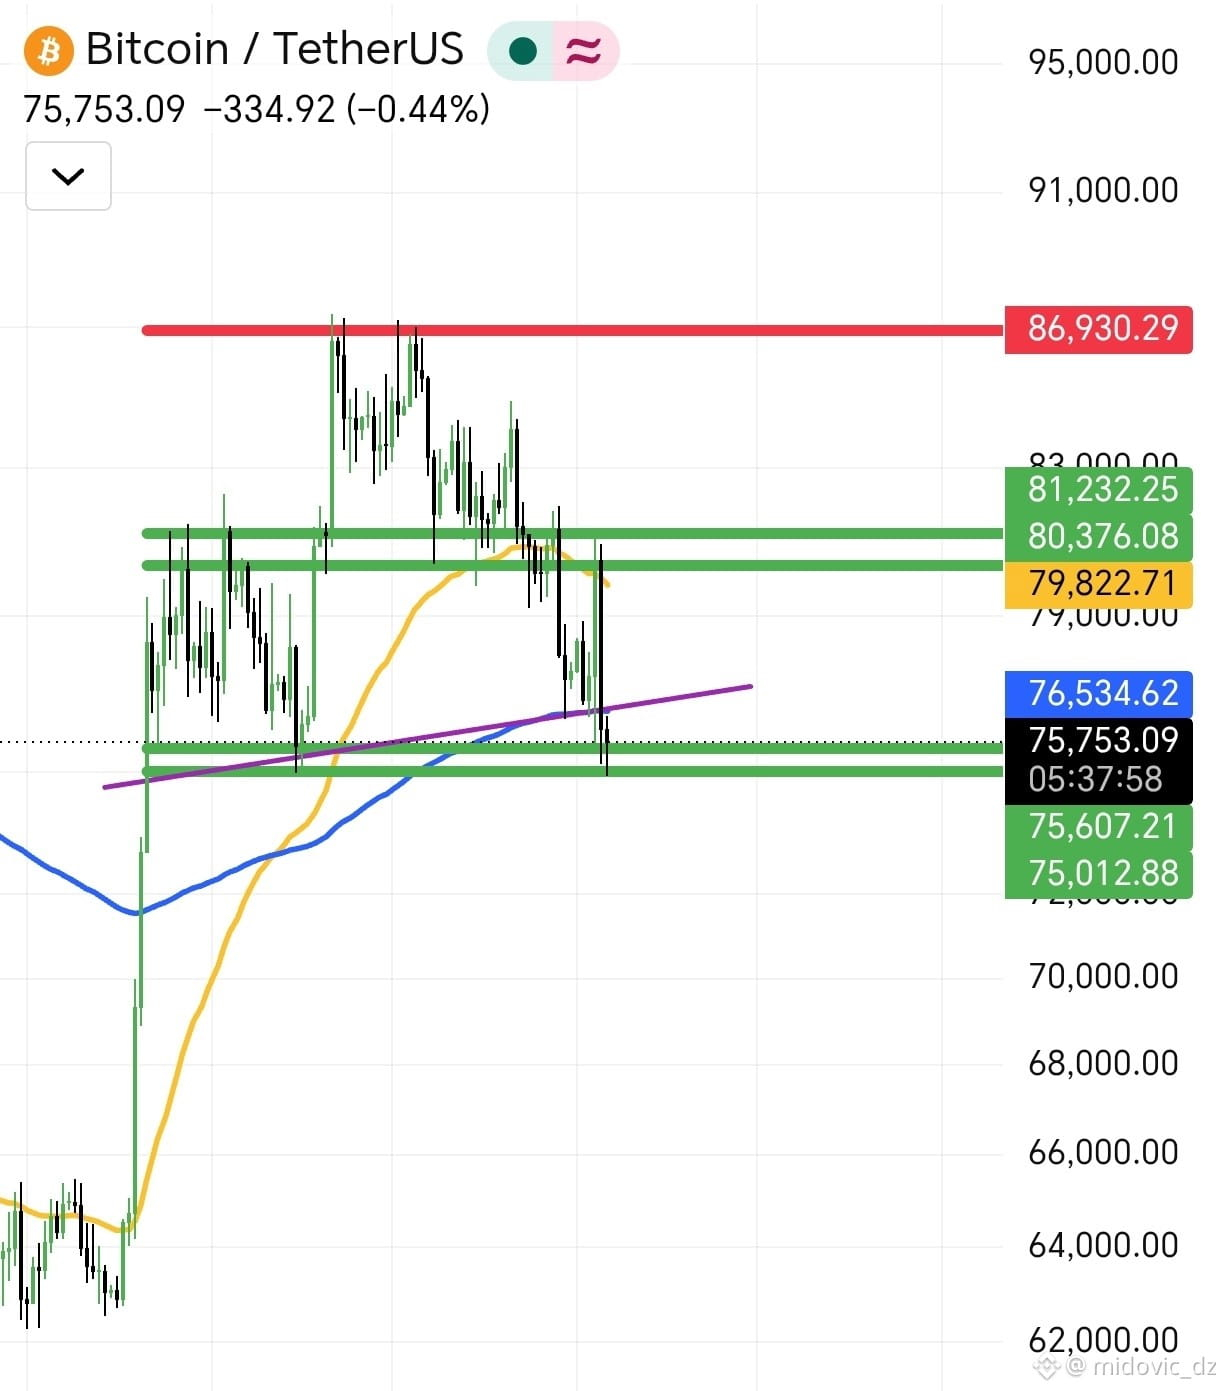
Current pivot zone: The price is currently near a major support range marked in green (between $75,607 and $75,753), which coincides with the ascending trendline (purple line). This makes it a crucial zone where prices may attempt to rebound.
Nearby resistance: The first resistance is at $76,534, followed by the stronger, higher resistance range between $79,822 and $80,376.
Moving averages: The price is approaching the moving average lines, reflecting volatility as the market awaits confirmation of the next direction.
Possible scenarios:
📈 Bullish rebound scenario: Holding above the current support zone and breaking through the $76,534 resistance could help Bitcoin recover and move toward testing the higher resistance levels.
📉 Support breakdown scenario: A break below the trendline and current support could lead to a further decline toward lower liquidity zones near $75,012.
Note: Please monitor the current candle's close carefully and manage risk with great caution.
#bitcoin #BTC☀️ #BinanceSquare
#CryptoAnalysis"
Quick technical analysis of Bitcoin ($BTC )
Bitcoin is currently trading around $75,753, down slightly by 0.44% as it tests a critical support zone.
Current pivot zone: The price is currently near a major support range marked in green (between $75,607 and $75,753), which coincides with the ascending trendline (purple line). This makes it a crucial zone where prices may attempt to rebound.
Nearby resistance: The first resistance is at $76,534, followed by the stronger, higher resistance range between $79,822 and $80,376.
Moving averages: The price is approaching the moving average lines, reflecting volatility as the market awaits confirmation of the next direction.
Possible scenarios:
📈 Bullish rebound scenario: Holding above the current support zone and breaking through the $76,534 resistance could help Bitcoin recover and move toward testing the higher resistance levels.
📉 Support breakdown scenario: A break below the trendline and current support could lead to a further decline toward lower liquidity zones near $75,012.
Note: Please monitor the current candle's close carefully and manage risk with great caution.
#bitcoin #BTC☀️ #BinanceSquare
#CryptoAnalysis"