
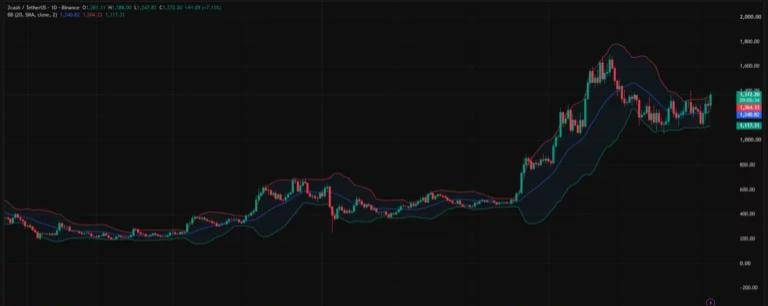

Zcash has recovered above $1,370 on Nov. 6, gaining 7.11% on its daily chart as traders watch whether a breakthrough of resistance can support a November rally toward $1,500 and potentially $2,000.
The daily chart showed $ZEC at $1,372.20 at 14:54 UTC, following a session that opened at $1,281.11 and touched a low of $1,247.83. Buyers pushed the token back toward the ceiling of its recent trading range after several unsuccessful recovery attempts during October.
The move brought ZEC into an area traders had been watching before this week’s rebound. A break above $1,370 as his condition for a potential squeeze when Zcash traded around $1,310 on Nov. 4.
Daily momentum improves as ZEC moves above its upper band
The daily Bollinger Bands placed the upper boundary at $1,364.33, slightly below the chart price. Zcash was therefore attempting to move beyond both its recent horizontal resistance and the upper edge of its volatility range.
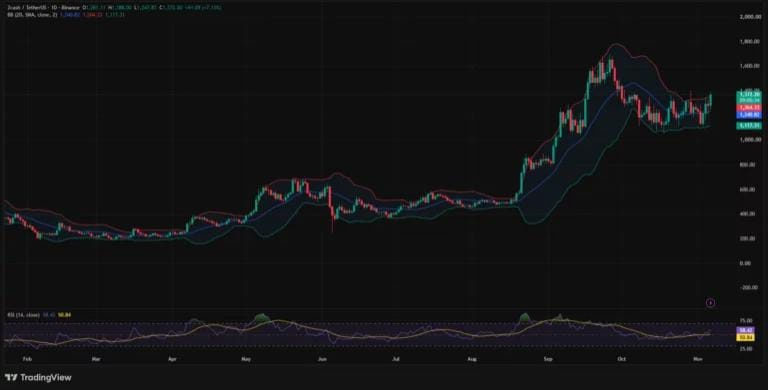
A daily close above the $1,350–$1,388 area, followed by support holding on a pullback, would strengthen the breakout case. A retreat beneath the same region would leave the latest move vulnerable to another rejection.
Momentum had improved alongside the recovery. The daily relative strength index stood at 58.42, above its accompanying average of 50.84 and the neutral 50 threshold. The reading remained below 70, leaving ZEC outside conventional overbought territory despite its session gain.
The weekly chart showed a similar rebound, with ZEC trading at $1,366.64 after touching $1,120.03 earlier in the week. Its gain stood at 10.70%, although the weekly candle remained unfinished.
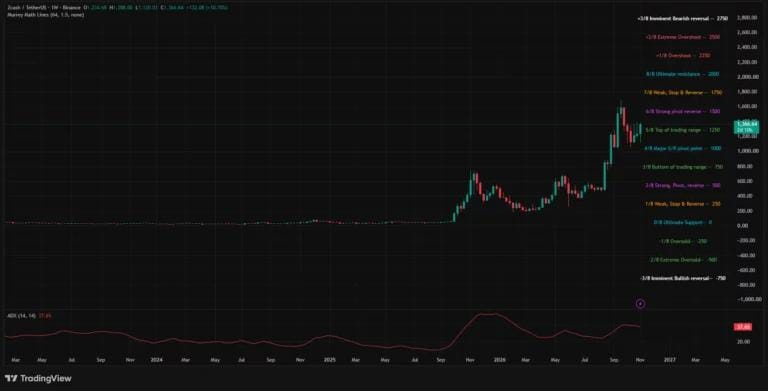
Weekly ADX measured 37.65, indicating established trend strength without independently identifying its direction. The Murrey Math overlay placed price above $1,250, with $1,500 as the next marked resistance and $1,750 beyond it.
Liquidation clusters surround the breakout attempt
CoinGlass’s one-week liquidation heatmap showed prominent estimated liquidation concentrations around $1,340–$1,350, followed by additional bands toward $1,365–$1,385. The latest upward move was entering that overhead region.
Short positions liquidated during a rise can generate forced buying, potentially accelerating a breakout. The heatmap identifies estimated liquidation exposure, however, rather than establishing how many positions have already been closed.
Below price, concentrations appeared around $1,260–$1,270 and $1,215–$1,220. A failed breakout could bring those areas back into focus as ZEC retraces through its recent range.
The daily Bollinger middle band at $1,240.82 provides a separate support reference close to the weekly $1,250 level. Losing that zone would weaken the recovery structure and expose the lower band near $1,117.31.
That lower boundary closely matches the week’s $1,120.03 low, where the weekly candle began its recovery.