$BTC Crypto Circle Analyst: 11.7 Bitcoin (BTC): When candlesticks fall silent, indicators speak for them—4 overlooked micro-signals
As I write this, it’s already late at night. After Bitcoin surged above 87,000 in the October rally, it has now been in a month-long correction and is stuck at 75,500, an awkward in-between level. Many people have started to panic over the past couple of days: are we heading back to 57,000? Here’s my conclusion first: this isn’t a crash, but a normal pullback after a major rally. Whether the pullback can hold will determine whether the next move is a trend or more sideways trading. Every day, after reviewing the daily and 4-hour charts, I jot down key levels, trigger conditions, and stop-loss logic here. Follow me, and you won’t be kicking yourself when the market switches between bulls and bears in the next leg.
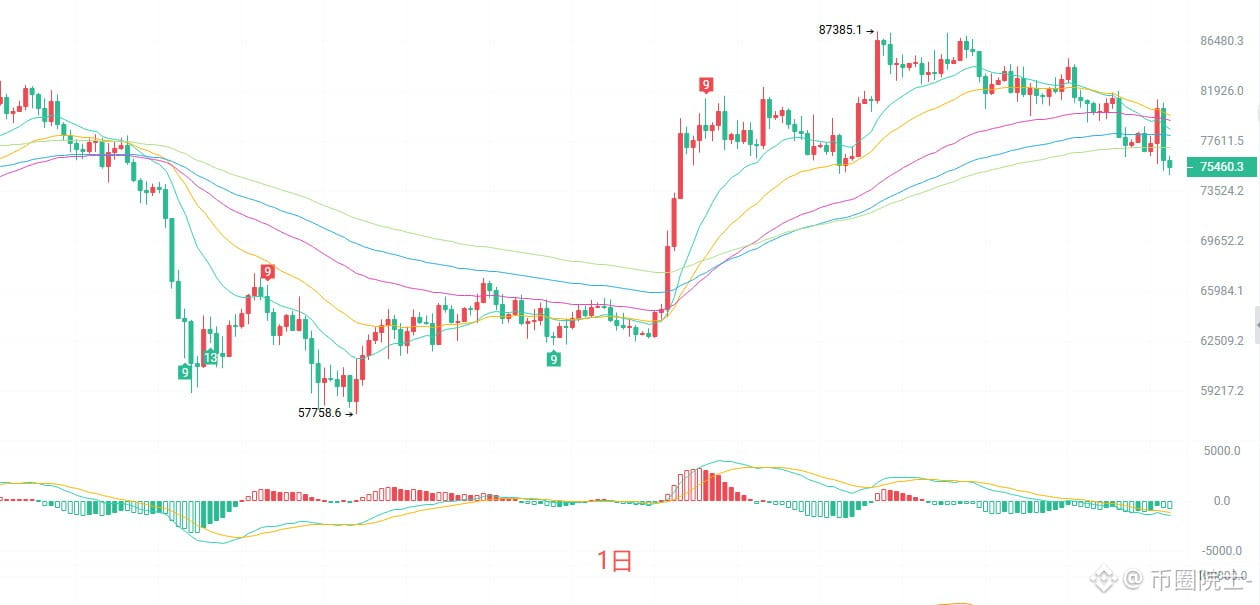
The daily candlestick chart has slid from its October high to below all the EMAs: EMA15 at 78606, EMA30 at 79799, EMA60 at 79425, and EMA90 at 78119. The short- and medium-term moving averages are aligned bearishly, with price capped below the cluster of moving averages. The MACD histogram is still expanding in the negative, suggesting that bearish momentum has not yet fully played out. The lower Bollinger Band at 74991 is currently the most important line of defense on the daily chart. Today’s close landed right around this level; whether it holds will determine whether we see a rebound next week or another leg down.
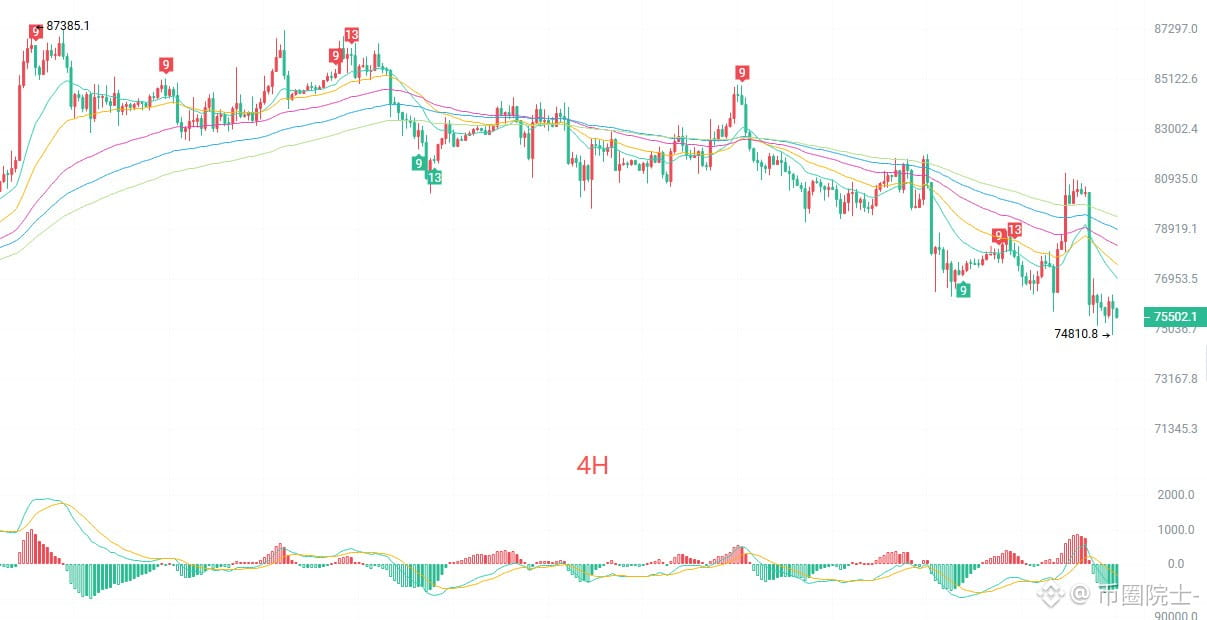
The 4-hour candlestick chart has been drifting lower beneath EMA15 and EMA30, with each rebound reaching a lower high than the last. The current close is 75483, with EMA15 at 76974 and EMA30 at 77532. As long as the rebound cannot reclaim EMA15, the bearish structure remains intact. The MACD histogram has turned down and widened again, while the lower Bollinger Band at 74004 offers support below the daily-chart level. The TD sequence has already reached counts of 9 and 13, so a technical short-term bounce is due, but a bounce does not mean a reversal.
Short-term levels to watch:
Long: 75200–74700, if support holds; stop-loss 500 points; targets 77000–78500.
Short: 78500–79000, if upward momentum stalls; stop-loss 500 points; targets 77500–76500.
For specific trades, rely on real-time order-book data. For more information, please contact the author. Articles are published with a delay; this is for reference only, and you assume all risk.
#BTC走势分析
As I write this, it’s already late at night. After Bitcoin surged above 87,000 in the October rally, it has now been in a month-long correction and is stuck at 75,500, an awkward in-between level. Many people have started to panic over the past couple of days: are we heading back to 57,000? Here’s my conclusion first: this isn’t a crash, but a normal pullback after a major rally. Whether the pullback can hold will determine whether the next move is a trend or more sideways trading. Every day, after reviewing the daily and 4-hour charts, I jot down key levels, trigger conditions, and stop-loss logic here. Follow me, and you won’t be kicking yourself when the market switches between bulls and bears in the next leg.
The daily candlestick chart has slid from its October high to below all the EMAs: EMA15 at 78606, EMA30 at 79799, EMA60 at 79425, and EMA90 at 78119. The short- and medium-term moving averages are aligned bearishly, with price capped below the cluster of moving averages. The MACD histogram is still expanding in the negative, suggesting that bearish momentum has not yet fully played out. The lower Bollinger Band at 74991 is currently the most important line of defense on the daily chart. Today’s close landed right around this level; whether it holds will determine whether we see a rebound next week or another leg down.
The 4-hour candlestick chart has been drifting lower beneath EMA15 and EMA30, with each rebound reaching a lower high than the last. The current close is 75483, with EMA15 at 76974 and EMA30 at 77532. As long as the rebound cannot reclaim EMA15, the bearish structure remains intact. The MACD histogram has turned down and widened again, while the lower Bollinger Band at 74004 offers support below the daily-chart level. The TD sequence has already reached counts of 9 and 13, so a technical short-term bounce is due, but a bounce does not mean a reversal.
Short-term levels to watch:
Long: 75200–74700, if support holds; stop-loss 500 points; targets 77000–78500.
Short: 78500–79000, if upward momentum stalls; stop-loss 500 points; targets 77500–76500.
For specific trades, rely on real-time order-book data. For more information, please contact the author. Articles are published with a delay; this is for reference only, and you assume all risk.
#BTC走势分析