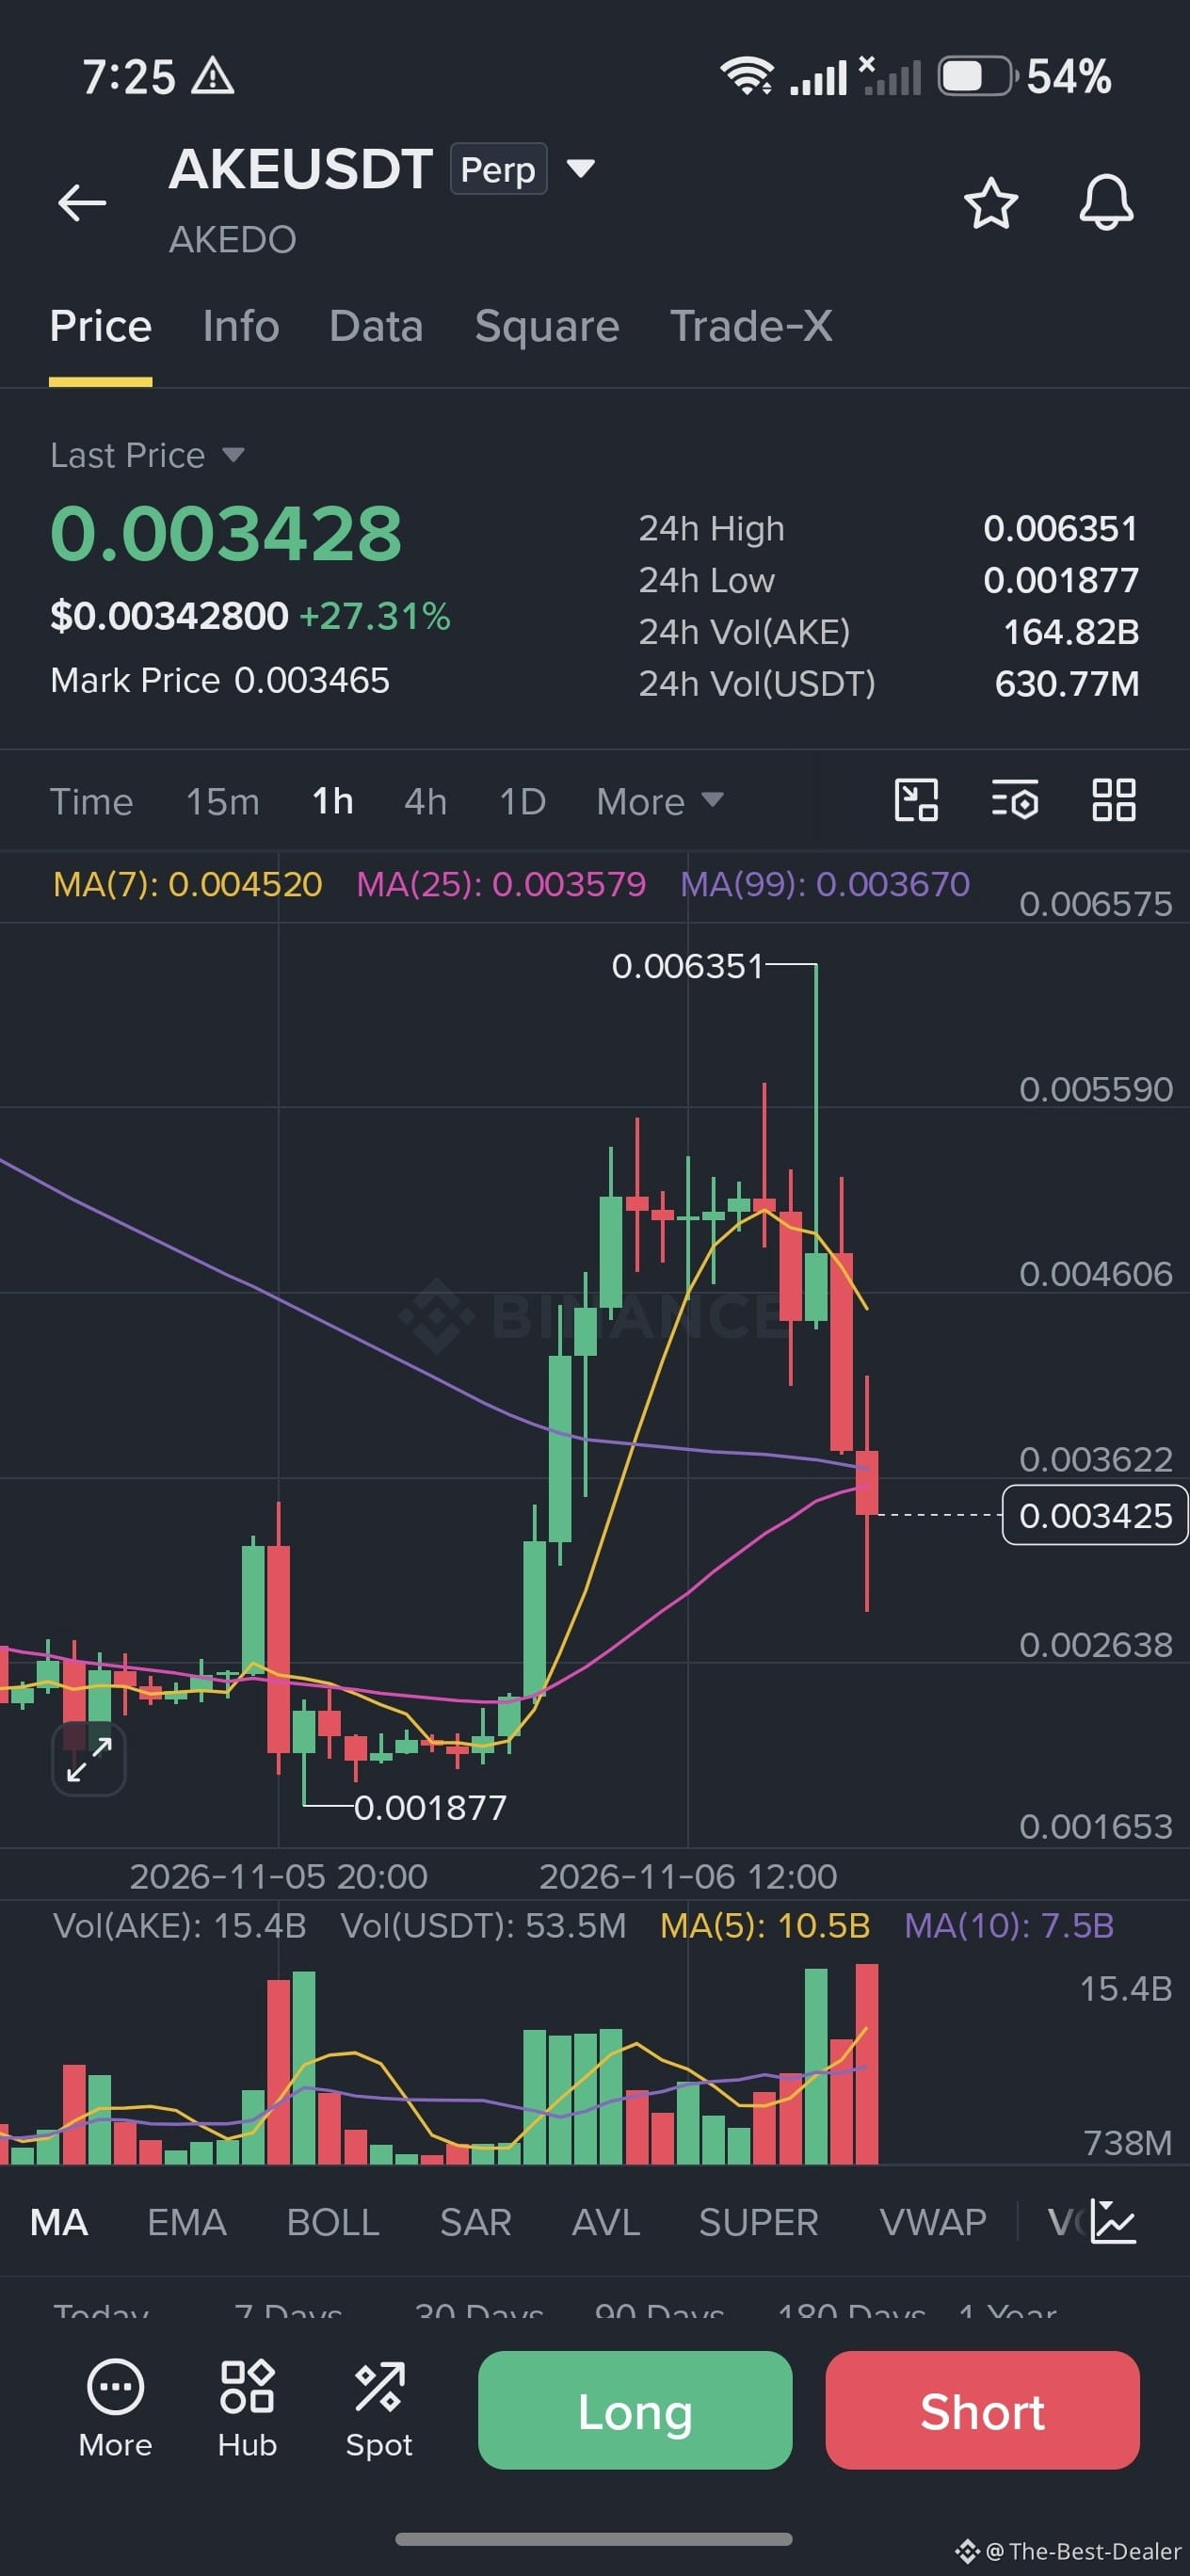
Technical Breakdown (1-Hour Chart)
Moving Average Crossover / Rejection: The price pumped to a 24-hour high of 0.006351 before experiencing a sharp drop. It has broken below the 7-period MA (0.004520, yellow line) and the 25-period MA (0.003579, pink line), currently testing support near the 99-period MA (0.003670, purple line) around 0.003425 – 0.003428.
Volume Spike: The massive red volume bar on the recent hourly candles indicates strong selling pressure after reaching the local peak.
Momentum: The rapid rejection from 0.006351 down to the current level shows significant downside momentum.
Execution Parameters
ParameterPrice LevelNotesCurrent Price0.003428Local support test areaShort Entry Range0.003450 – 0.003600On a minor pullback toward the broken MA(25) / MA(99) resistanceInvalidation / Stop Loss0.003900 – 0.004100Above the local consolidation node / MA(7) recovery zoneTake Profit 1 (TP1)0.002638Intermediate support horizontal lineTake Profit 2 (TP2)0.00187724-hour low support level
Key Considerations
Wait for a Retest (Optional): Entering directly at market price after a steep red candle carries risk of a minor bounce (retest of 0.00358–0.00367). Entering on a lower-timeframe bounce can improve the risk-to-reward ratio.
Leverage & Position Size: High volatility is present (24h high/low spread is over 200%). Keep leverage conservative and risk managed strictly per account balance.
$AKE
Moving Average Crossover / Rejection: The price pumped to a 24-hour high of 0.006351 before experiencing a sharp drop. It has broken below the 7-period MA (0.004520, yellow line) and the 25-period MA (0.003579, pink line), currently testing support near the 99-period MA (0.003670, purple line) around 0.003425 – 0.003428.
Volume Spike: The massive red volume bar on the recent hourly candles indicates strong selling pressure after reaching the local peak.
Momentum: The rapid rejection from 0.006351 down to the current level shows significant downside momentum.
Execution Parameters
ParameterPrice LevelNotesCurrent Price0.003428Local support test areaShort Entry Range0.003450 – 0.003600On a minor pullback toward the broken MA(25) / MA(99) resistanceInvalidation / Stop Loss0.003900 – 0.004100Above the local consolidation node / MA(7) recovery zoneTake Profit 1 (TP1)0.002638Intermediate support horizontal lineTake Profit 2 (TP2)0.00187724-hour low support level
Key Considerations
Wait for a Retest (Optional): Entering directly at market price after a steep red candle carries risk of a minor bounce (retest of 0.00358–0.00367). Entering on a lower-timeframe bounce can improve the risk-to-reward ratio.
Leverage & Position Size: High volatility is present (24h high/low spread is over 200%). Keep leverage conservative and risk managed strictly per account balance.
$AKE