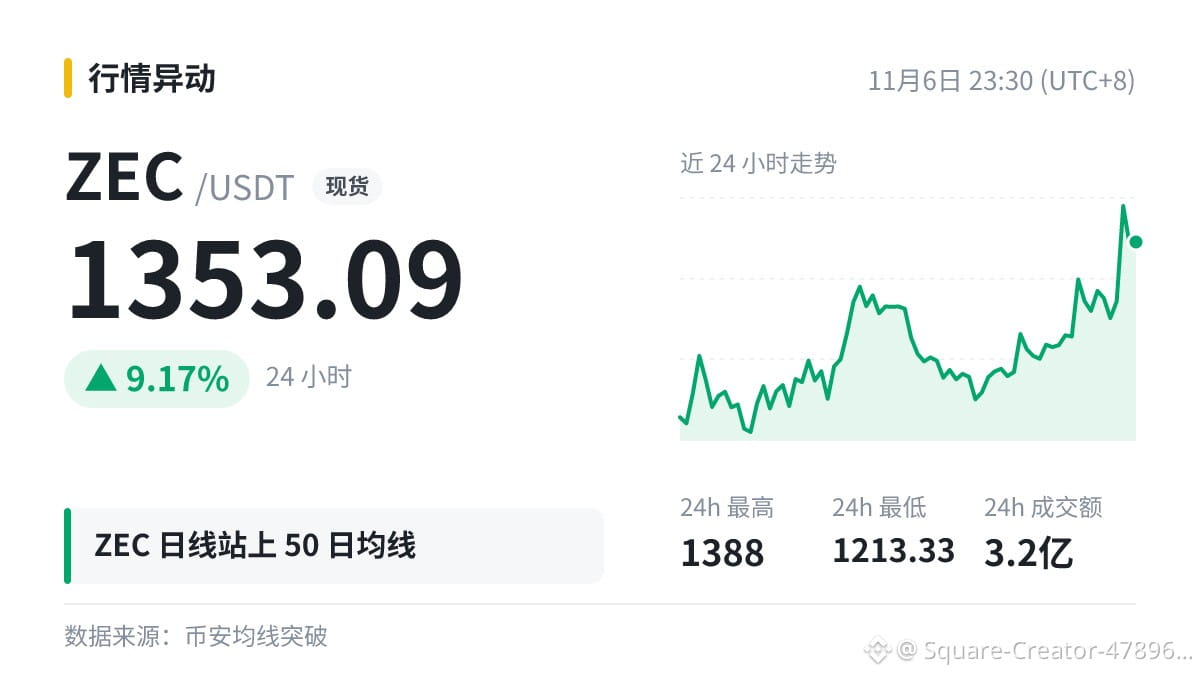
$ZEC The daily chart is above MA50 (1316.96).
Let’s use this number to break down moving averages.
The slope of the moving average itself is also worth watching: it means something different when the price crosses above it while the average is still falling versus when the price moves above it as the average starts to turn upward.
A moving average is just a line calculated from average prices; it has no special power in itself. It often gets attention simply because so many people are watching it.
The same reading can mean completely different things in different market conditions, so don’t blindly apply a single rule.
#ZEC
Let’s use this number to break down moving averages.
The slope of the moving average itself is also worth watching: it means something different when the price crosses above it while the average is still falling versus when the price moves above it as the average starts to turn upward.
A moving average is just a line calculated from average prices; it has no special power in itself. It often gets attention simply because so many people are watching it.
The same reading can mean completely different things in different market conditions, so don’t blindly apply a single rule.
#ZEC