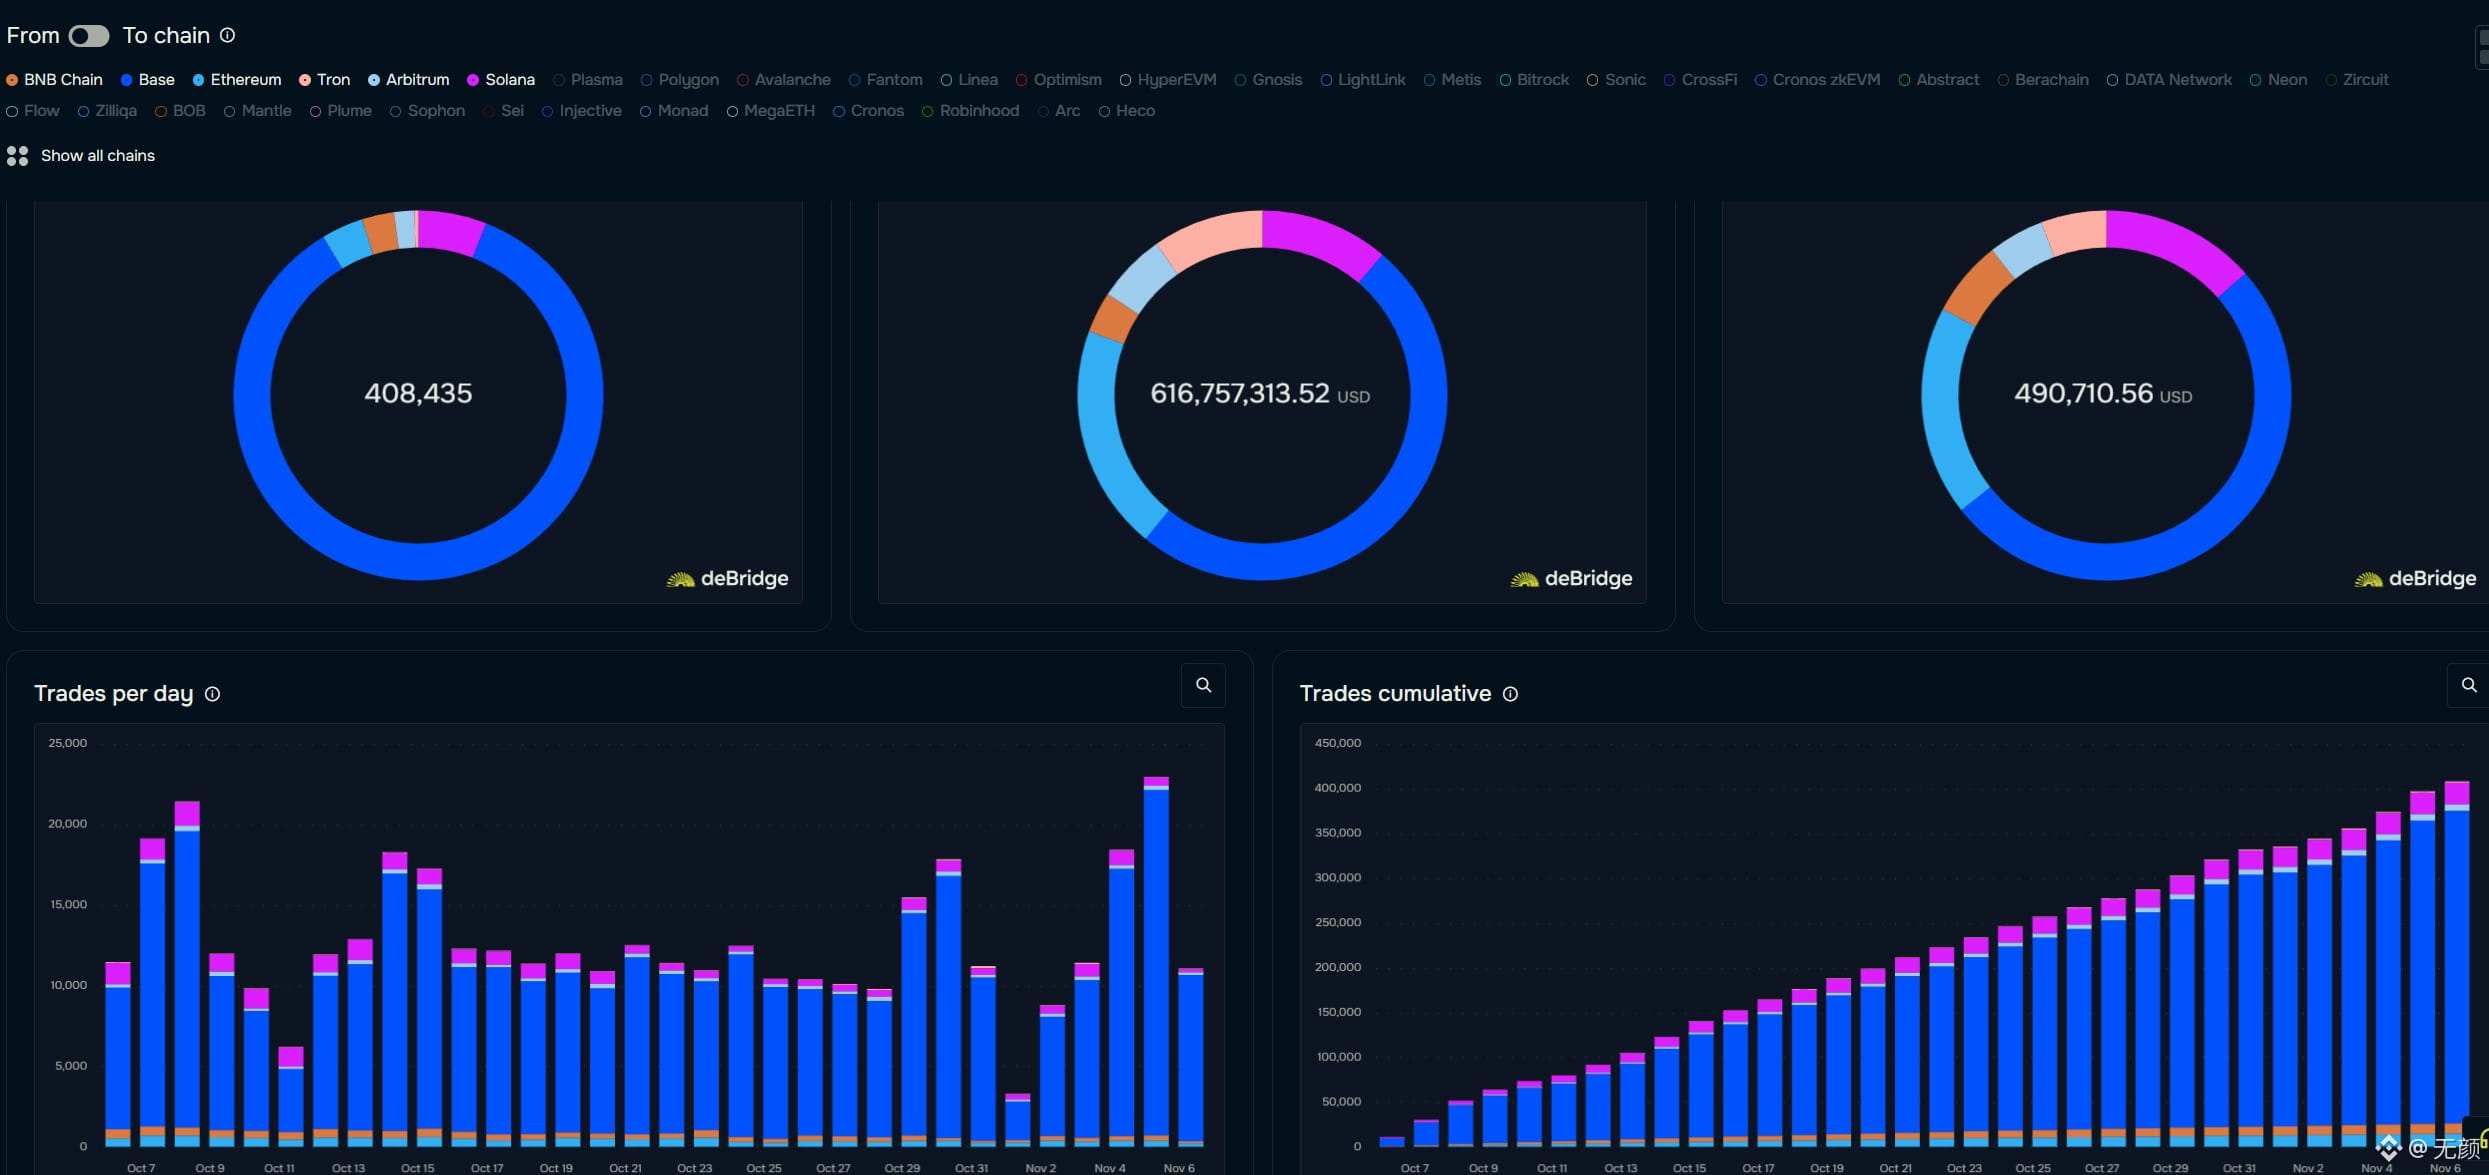
deBridge Analytics brings every on-chain transaction settled through deBridge together in one unified, real-time, fully open dashboard. Free to use, with no permissions required, and open to everyone. Data updates in real time, charts are easy to understand, and you can freely switch between time periods and chains.
- Fund flows between chains over any time period (today, past 7 days, past 30 days, past 3 months, or all time)
- Total number of transactions, total transaction volume, and DAO revenue
- Daily transaction volume and cumulative transaction volume trends
- Daily active users and new users
- Transaction share and volume by chain
- Bidirectional filtering by source and destination chain
- Fund flows between chains over any time period (today, past 7 days, past 30 days, past 3 months, or all time)
- Total number of transactions, total transaction volume, and DAO revenue
- Daily transaction volume and cumulative transaction volume trends
- Daily active users and new users
- Transaction share and volume by chain
- Bidirectional filtering by source and destination chain