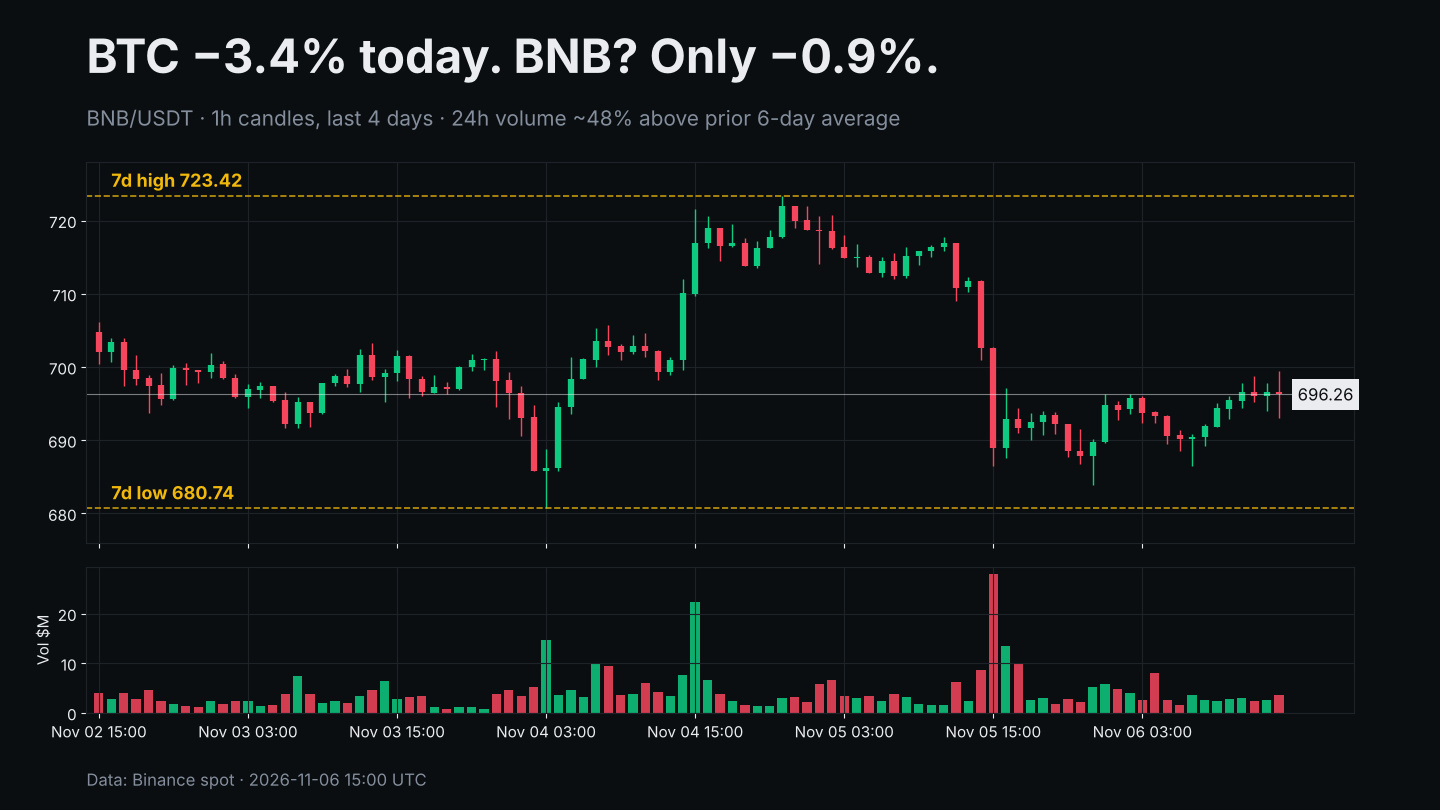
$BTC drops 3.4% in 24h and $BNB barely flinches: just -0.9%, sitting at 696.
That relative strength is the story. Yesterday's flush took BNB from ~717 to the 686 area on the biggest hourly volume of the week, and since then buyers have defended every dip around 684. Today's 24h range is tight: 683.94 to 702.71.
Levels I'm watching:
• 680 – 7-day low (680.74) and roughly the 30-day low (680.00). Lose that and the chart opens up.
• 702–703 – today's high and the 24h open. Reclaiming it flips the intraday bias.
• 723 – 7-day high, also right at the 20-day average close (~723). That's the real ceiling.
Volume check: ~$121M traded in the last 24h vs a ~$82M daily average over the prior 6 days. Higher volume on a small move usually means absorption, not panic.
Bigger picture is still soft: BNB is down ~9.9% over 30 days and flat on the week (-0.4%). Holding up well vs BTC is good, but it's not a trend change until 723 breaks.
Does BNB keep decoupling if BTC slides further, or does 680 get tested?
Not financial advice.
#BNB #CryptoTrading #MarketAnalysis
That relative strength is the story. Yesterday's flush took BNB from ~717 to the 686 area on the biggest hourly volume of the week, and since then buyers have defended every dip around 684. Today's 24h range is tight: 683.94 to 702.71.
Levels I'm watching:
• 680 – 7-day low (680.74) and roughly the 30-day low (680.00). Lose that and the chart opens up.
• 702–703 – today's high and the 24h open. Reclaiming it flips the intraday bias.
• 723 – 7-day high, also right at the 20-day average close (~723). That's the real ceiling.
Volume check: ~$121M traded in the last 24h vs a ~$82M daily average over the prior 6 days. Higher volume on a small move usually means absorption, not panic.
Bigger picture is still soft: BNB is down ~9.9% over 30 days and flat on the week (-0.4%). Holding up well vs BTC is good, but it's not a trend change until 723 breaks.
Does BNB keep decoupling if BTC slides further, or does 680 get tested?
Not financial advice.
#BNB #CryptoTrading #MarketAnalysis