🚀 Quick Analysis of $HYPE /USDT: Decision Time or Bear Trap?
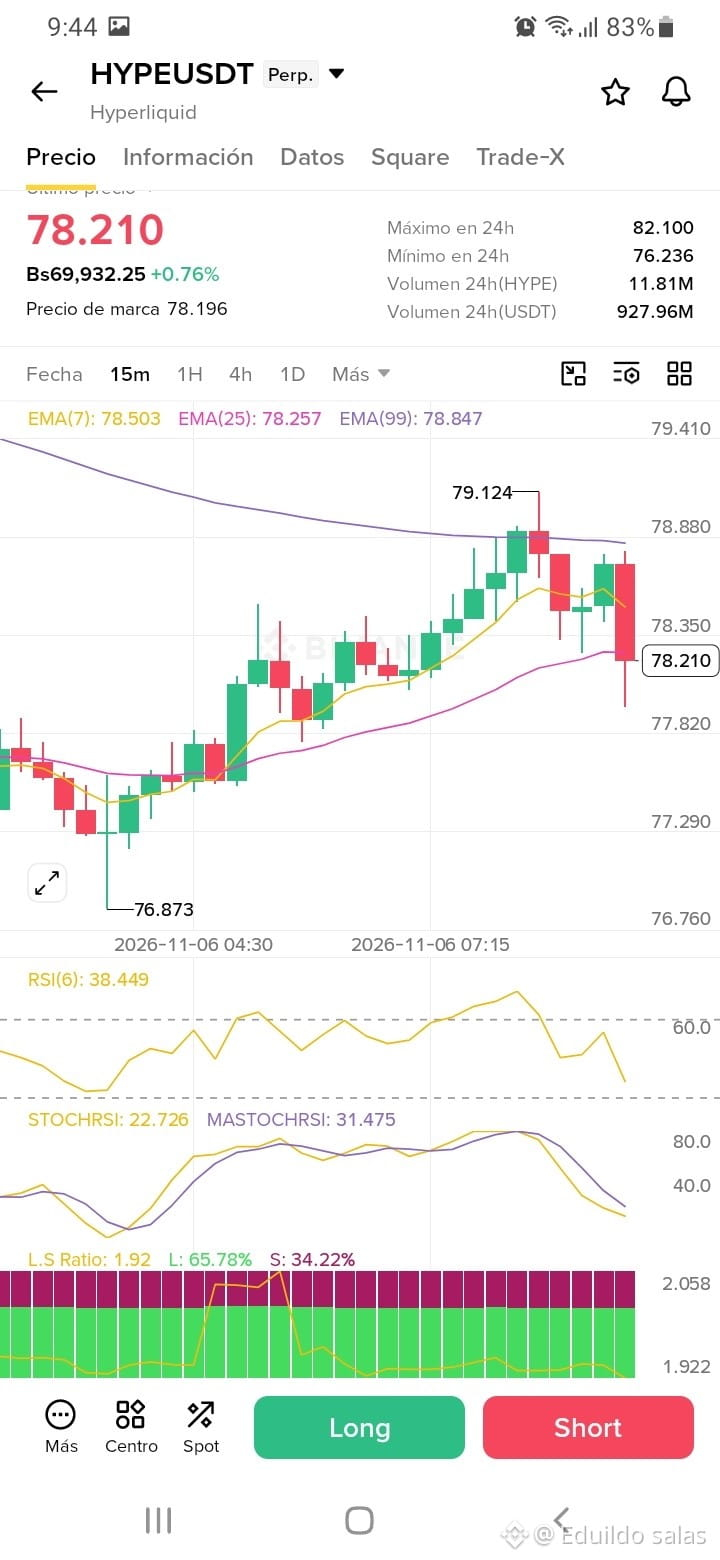
Price action for the HYPE/USDT (Perpetual) pair on the 15-minute timeframe shows a highly interesting move after touching a recent high of 79.124 and a critical support level at 76.873. It is currently trading at 78.210, showing a slight +0.76% bounce in recent hours, but trapped in a zone of high technical tension.
📊 Key Chart Details:
Moving Averages (EMAs): The trend lines are tightly compressed. The EMA(7) at 78.503 and the EMA(25) at 78.257 are acting as nearby immediate resistance, while the EMA(99) at 78.847 looms overhead as the major wall to break through.
Momentum Indicators (RSI & StochRSI):
The RSI(6) is at a moderate 38.44, reflecting short-term selling pressure without yet reaching the extreme oversold zone.
The StochRSI shows a steep downward slope, crossing lower in the lower-middle zone (22.72 / 31.47), suggesting that bears are trying to apply a little more pressure before looking for a solid bounce.
Market Sentiment (L/S Ratio): The Long/Short ratio remains at 1.92, with a clear dominance of long positions (65.78% Long versus 34.22% Short), keeping the market alert to potential liquidity sweeps at the extremes.
💡 What to Expect?
The 77.80–78.00 zone is acting as a magnet and a short-term support base. If the bulls manage to defend this level and break above the 7-period EMA with volume, we could see a move back toward 78.8–79.1. Otherwise, keep a close eye on a loss of this base to avoid deeper corrections.
Are you accumulating at this level, or would you rather wait for confirmation? Let me know in the comments! 👇🔥
#HYPE #BinanceSquare #BinanceReopensWithdrawalsForMoreAssets #HyperliquidStrategiesHolds38.52MillionHYPE
Price action for the HYPE/USDT (Perpetual) pair on the 15-minute timeframe shows a highly interesting move after touching a recent high of 79.124 and a critical support level at 76.873. It is currently trading at 78.210, showing a slight +0.76% bounce in recent hours, but trapped in a zone of high technical tension.
📊 Key Chart Details:
Moving Averages (EMAs): The trend lines are tightly compressed. The EMA(7) at 78.503 and the EMA(25) at 78.257 are acting as nearby immediate resistance, while the EMA(99) at 78.847 looms overhead as the major wall to break through.
Momentum Indicators (RSI & StochRSI):
The RSI(6) is at a moderate 38.44, reflecting short-term selling pressure without yet reaching the extreme oversold zone.
The StochRSI shows a steep downward slope, crossing lower in the lower-middle zone (22.72 / 31.47), suggesting that bears are trying to apply a little more pressure before looking for a solid bounce.
Market Sentiment (L/S Ratio): The Long/Short ratio remains at 1.92, with a clear dominance of long positions (65.78% Long versus 34.22% Short), keeping the market alert to potential liquidity sweeps at the extremes.
💡 What to Expect?
The 77.80–78.00 zone is acting as a magnet and a short-term support base. If the bulls manage to defend this level and break above the 7-period EMA with volume, we could see a move back toward 78.8–79.1. Otherwise, keep a close eye on a loss of this base to avoid deeper corrections.
Are you accumulating at this level, or would you rather wait for confirmation? Let me know in the comments! 👇🔥
#HYPE #BinanceSquare #BinanceReopensWithdrawalsForMoreAssets #HyperliquidStrategiesHolds38.52MillionHYPE