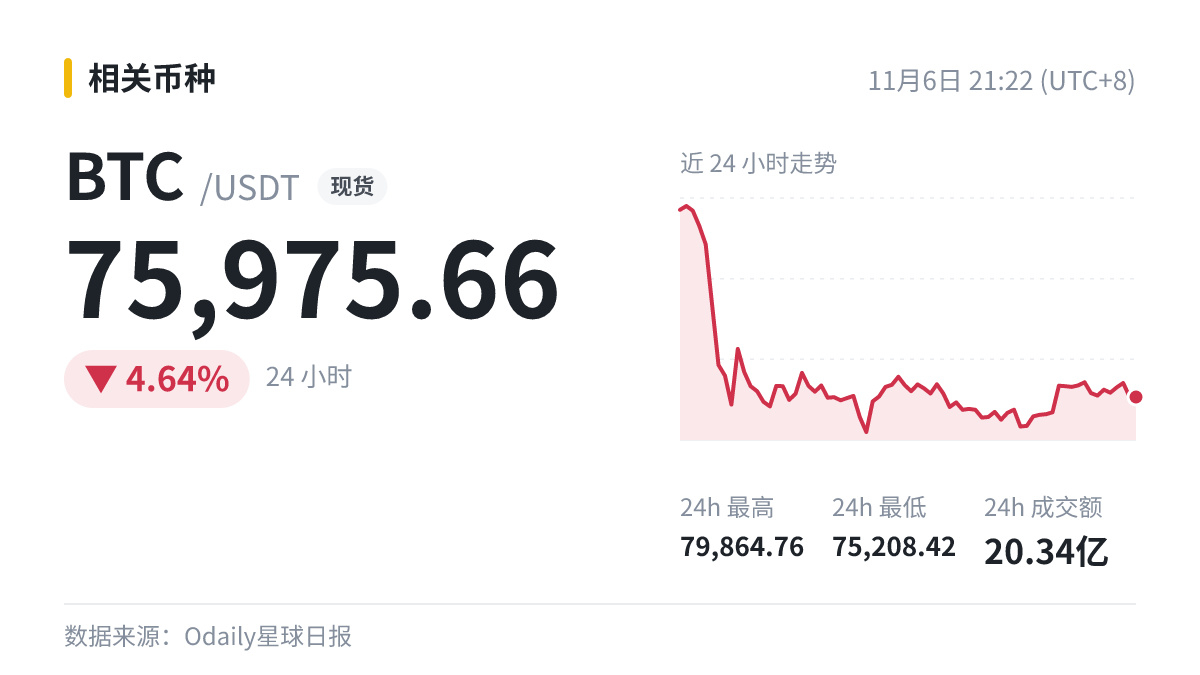
Looking at the chart, the top and bottom of the range are the levels that really matter.
Take this one, for example: ASTS is down 15.0% over 24 hours.
Next, watch two things: whether volume can keep up, and whether buyers step in on a pullback.
$BTC .
#BTC
Take this one, for example: ASTS is down 15.0% over 24 hours.
Next, watch two things: whether volume can keep up, and whether buyers step in on a pullback.
$BTC .
#BTC