BSB Pushes Up 4% and Tests the MA(99): Is a Breakout Brewing?
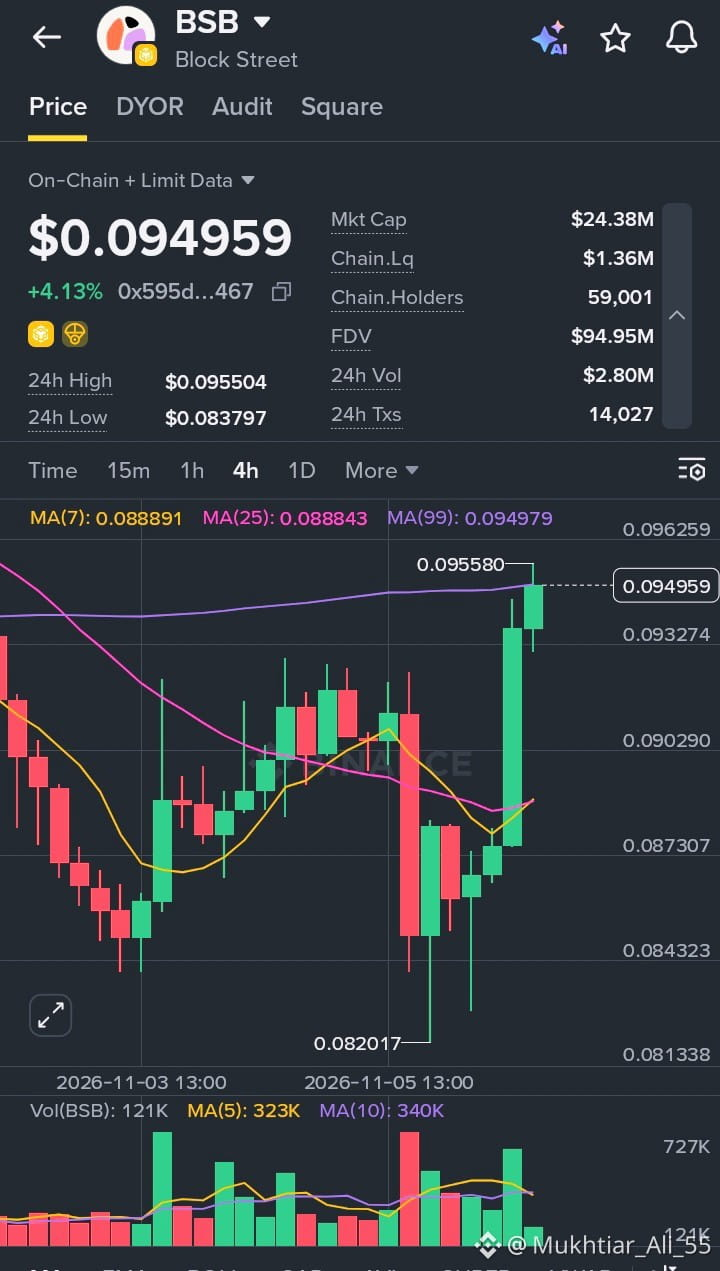
Block Street (BSB) is showing a steady recovery. The token is trading at $0.094959, up 4.13% over the last 24 hours, with a high of $0.095504 and a low of $0.083797.
The 4H chart shows a sharp dip followed by a firm bounce. Price fell to around $0.082017, then buyers stepped in with a run of green candles that carried it up to a recent high of $0.095580. The latest candle is sitting right at the MA(99) line near 0.094979, which makes this a key decision zone.
Key numbers at a glance:
Market Cap: $24.38M
FDV: $94.95M
24h Volume: $2.80M
24h Transactions: 14,027
On-chain Holders: 59,001
On-chain Liquidity: $1.36M
Price has moved well above the MA(7) at 0.088891 and the MA(25) at 0.088843, and those two averages are now tightly bunched and turning upward, which is an early constructive sign. The real test is the MA(99): price has pressed into it, and a clean close above on solid volume would strengthen the bullish case. Volume on the last bar is light, though, and the recent average is lower than the heavy bars seen earlier, so the move still needs more participation to be convincing.
A rejection here would not be surprising, given the wick near $0.0955. In that case, the $0.0888 area where the shorter moving averages sit would be the first support to watch. With liquidity of about $1.36M against a $24.38M market cap, price can swing quickly in either direction, though a holder base of over 59,000 shows healthy community interest.
If you’re watching BSB, it may be smarter to wait for a confirmed break above the MA(99) with rising volume, or a calm pullback to support, rather than buying into resistance. Size your positions sensibly and only risk what you can afford to lose. This is not financial advice, just my read of the chart.
#BSB #BlockStreet #CryptoAnalysis #BinanceSquare #PriceAction
$BSB
Block Street (BSB) is showing a steady recovery. The token is trading at $0.094959, up 4.13% over the last 24 hours, with a high of $0.095504 and a low of $0.083797.
The 4H chart shows a sharp dip followed by a firm bounce. Price fell to around $0.082017, then buyers stepped in with a run of green candles that carried it up to a recent high of $0.095580. The latest candle is sitting right at the MA(99) line near 0.094979, which makes this a key decision zone.
Key numbers at a glance:
Market Cap: $24.38M
FDV: $94.95M
24h Volume: $2.80M
24h Transactions: 14,027
On-chain Holders: 59,001
On-chain Liquidity: $1.36M
Price has moved well above the MA(7) at 0.088891 and the MA(25) at 0.088843, and those two averages are now tightly bunched and turning upward, which is an early constructive sign. The real test is the MA(99): price has pressed into it, and a clean close above on solid volume would strengthen the bullish case. Volume on the last bar is light, though, and the recent average is lower than the heavy bars seen earlier, so the move still needs more participation to be convincing.
A rejection here would not be surprising, given the wick near $0.0955. In that case, the $0.0888 area where the shorter moving averages sit would be the first support to watch. With liquidity of about $1.36M against a $24.38M market cap, price can swing quickly in either direction, though a holder base of over 59,000 shows healthy community interest.
If you’re watching BSB, it may be smarter to wait for a confirmed break above the MA(99) with rising volume, or a calm pullback to support, rather than buying into resistance. Size your positions sensibly and only risk what you can afford to lose. This is not financial advice, just my read of the chart.
#BSB #BlockStreet #CryptoAnalysis #BinanceSquare #PriceAction
$BSB