【$BTC Bulls and Bears in a Tug-of-War: What Do RSI, MACD, and Moving Averages Say?】
【Hot Topic】
This Crypto.News flash has sparked plenty of discussion in the community, and the market reaction came quickly.
「Bitcoin ETFs lost $430 million as Fidelity reversed course」——Crypto.News reported: A positive day for US spot Bitcoin ETFs gave way to a $430.2 million withdrawal.
The biggest risk with event-driven market moves is that sentiment gets overextended, so whether key levels hold matters more than the news itself.
【Market Snapshot】
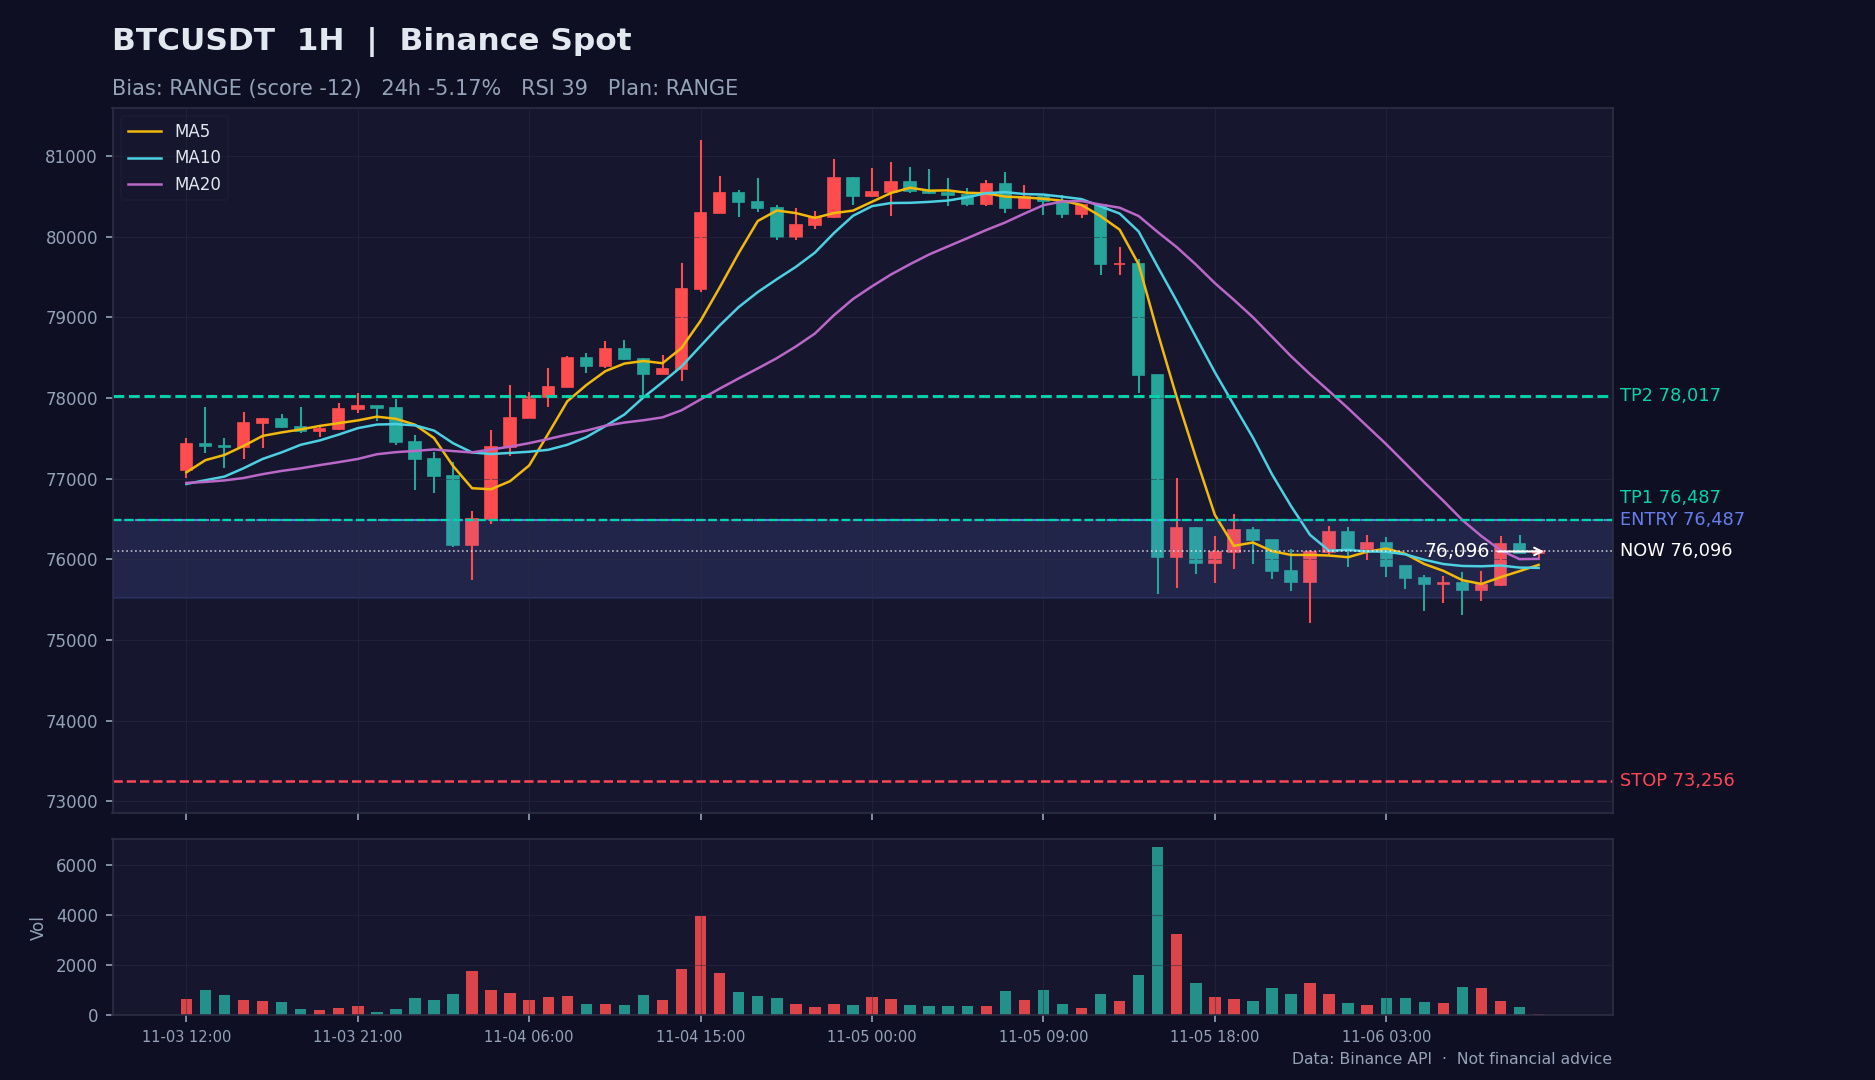
$BTC is currently trading at 76,096, down 5.17% over 24 hours, with 24-hour trading volume of around 2.1B USDT.
【Technical Breakdown】
· Moving averages: Short-term moving averages have crossed bullishly, and the price has climbed back above MA20. The trend is recovering, but MA60 has yet to be reclaimed.
· Momentum: The MACD fast line is above the zero line, with the histogram favoring the bulls, suggesting bullish momentum is still continuing; RSI(39) is weak, and a rebound needs confirmation from increased volume.
· Chart pattern: The price is hovering near the Bollinger middle band, and whether it holds will determine the short-term pace; volume has contracted (to 0.1 times the average), so directional signals should be treated with caution in these low-volume conditions.
【Directional Outlook】
Overall score: -12/100. Bulls and bears are locked in a tug-of-war: indicators are conflicting, so chasing trades is especially inadvisable right now. Consider trading the range with small positions, selling near the top and buying near the bottom, then following the trend once direction is confirmed (by a high-volume breakout above or below the range).
【Trade Plan Reference】
· Strategy: Range-bound
· Entry zone: 75,522 ~ 76,487
· Take profit: First target 76,487, second target 78,017
· Stop loss: 73,256
· Position size: Use small positions to sell near the top and buy near the bottom of the range; follow the trend after a breakout.
· Chart: Candlestick analysis chart included in the post (1-hour chart, red for rising and green for falling; entry zone/take-profit/stop-loss levels are marked with colored lines).
【Risk Warning】Small-cap coins are highly volatile, and event-driven moves can reverse quickly. Be sure to keep position sizes under control.
The above is for personal review and technical analysis only and does not constitute investment advice. DYOR.
$BTC #BTC #加密货币 #MarketAnalysis
【Hot Topic】
This Crypto.News flash has sparked plenty of discussion in the community, and the market reaction came quickly.
「Bitcoin ETFs lost $430 million as Fidelity reversed course」——Crypto.News reported: A positive day for US spot Bitcoin ETFs gave way to a $430.2 million withdrawal.
The biggest risk with event-driven market moves is that sentiment gets overextended, so whether key levels hold matters more than the news itself.
【Market Snapshot】
$BTC is currently trading at 76,096, down 5.17% over 24 hours, with 24-hour trading volume of around 2.1B USDT.
【Technical Breakdown】
· Moving averages: Short-term moving averages have crossed bullishly, and the price has climbed back above MA20. The trend is recovering, but MA60 has yet to be reclaimed.
· Momentum: The MACD fast line is above the zero line, with the histogram favoring the bulls, suggesting bullish momentum is still continuing; RSI(39) is weak, and a rebound needs confirmation from increased volume.
· Chart pattern: The price is hovering near the Bollinger middle band, and whether it holds will determine the short-term pace; volume has contracted (to 0.1 times the average), so directional signals should be treated with caution in these low-volume conditions.
【Directional Outlook】
Overall score: -12/100. Bulls and bears are locked in a tug-of-war: indicators are conflicting, so chasing trades is especially inadvisable right now. Consider trading the range with small positions, selling near the top and buying near the bottom, then following the trend once direction is confirmed (by a high-volume breakout above or below the range).
【Trade Plan Reference】
· Strategy: Range-bound
· Entry zone: 75,522 ~ 76,487
· Take profit: First target 76,487, second target 78,017
· Stop loss: 73,256
· Position size: Use small positions to sell near the top and buy near the bottom of the range; follow the trend after a breakout.
· Chart: Candlestick analysis chart included in the post (1-hour chart, red for rising and green for falling; entry zone/take-profit/stop-loss levels are marked with colored lines).
【Risk Warning】Small-cap coins are highly volatile, and event-driven moves can reverse quickly. Be sure to keep position sizes under control.
The above is for personal review and technical analysis only and does not constitute investment advice. DYOR.
$BTC #BTC #加密货币 #MarketAnalysis