
$ETH Evening outlook: 11/6.
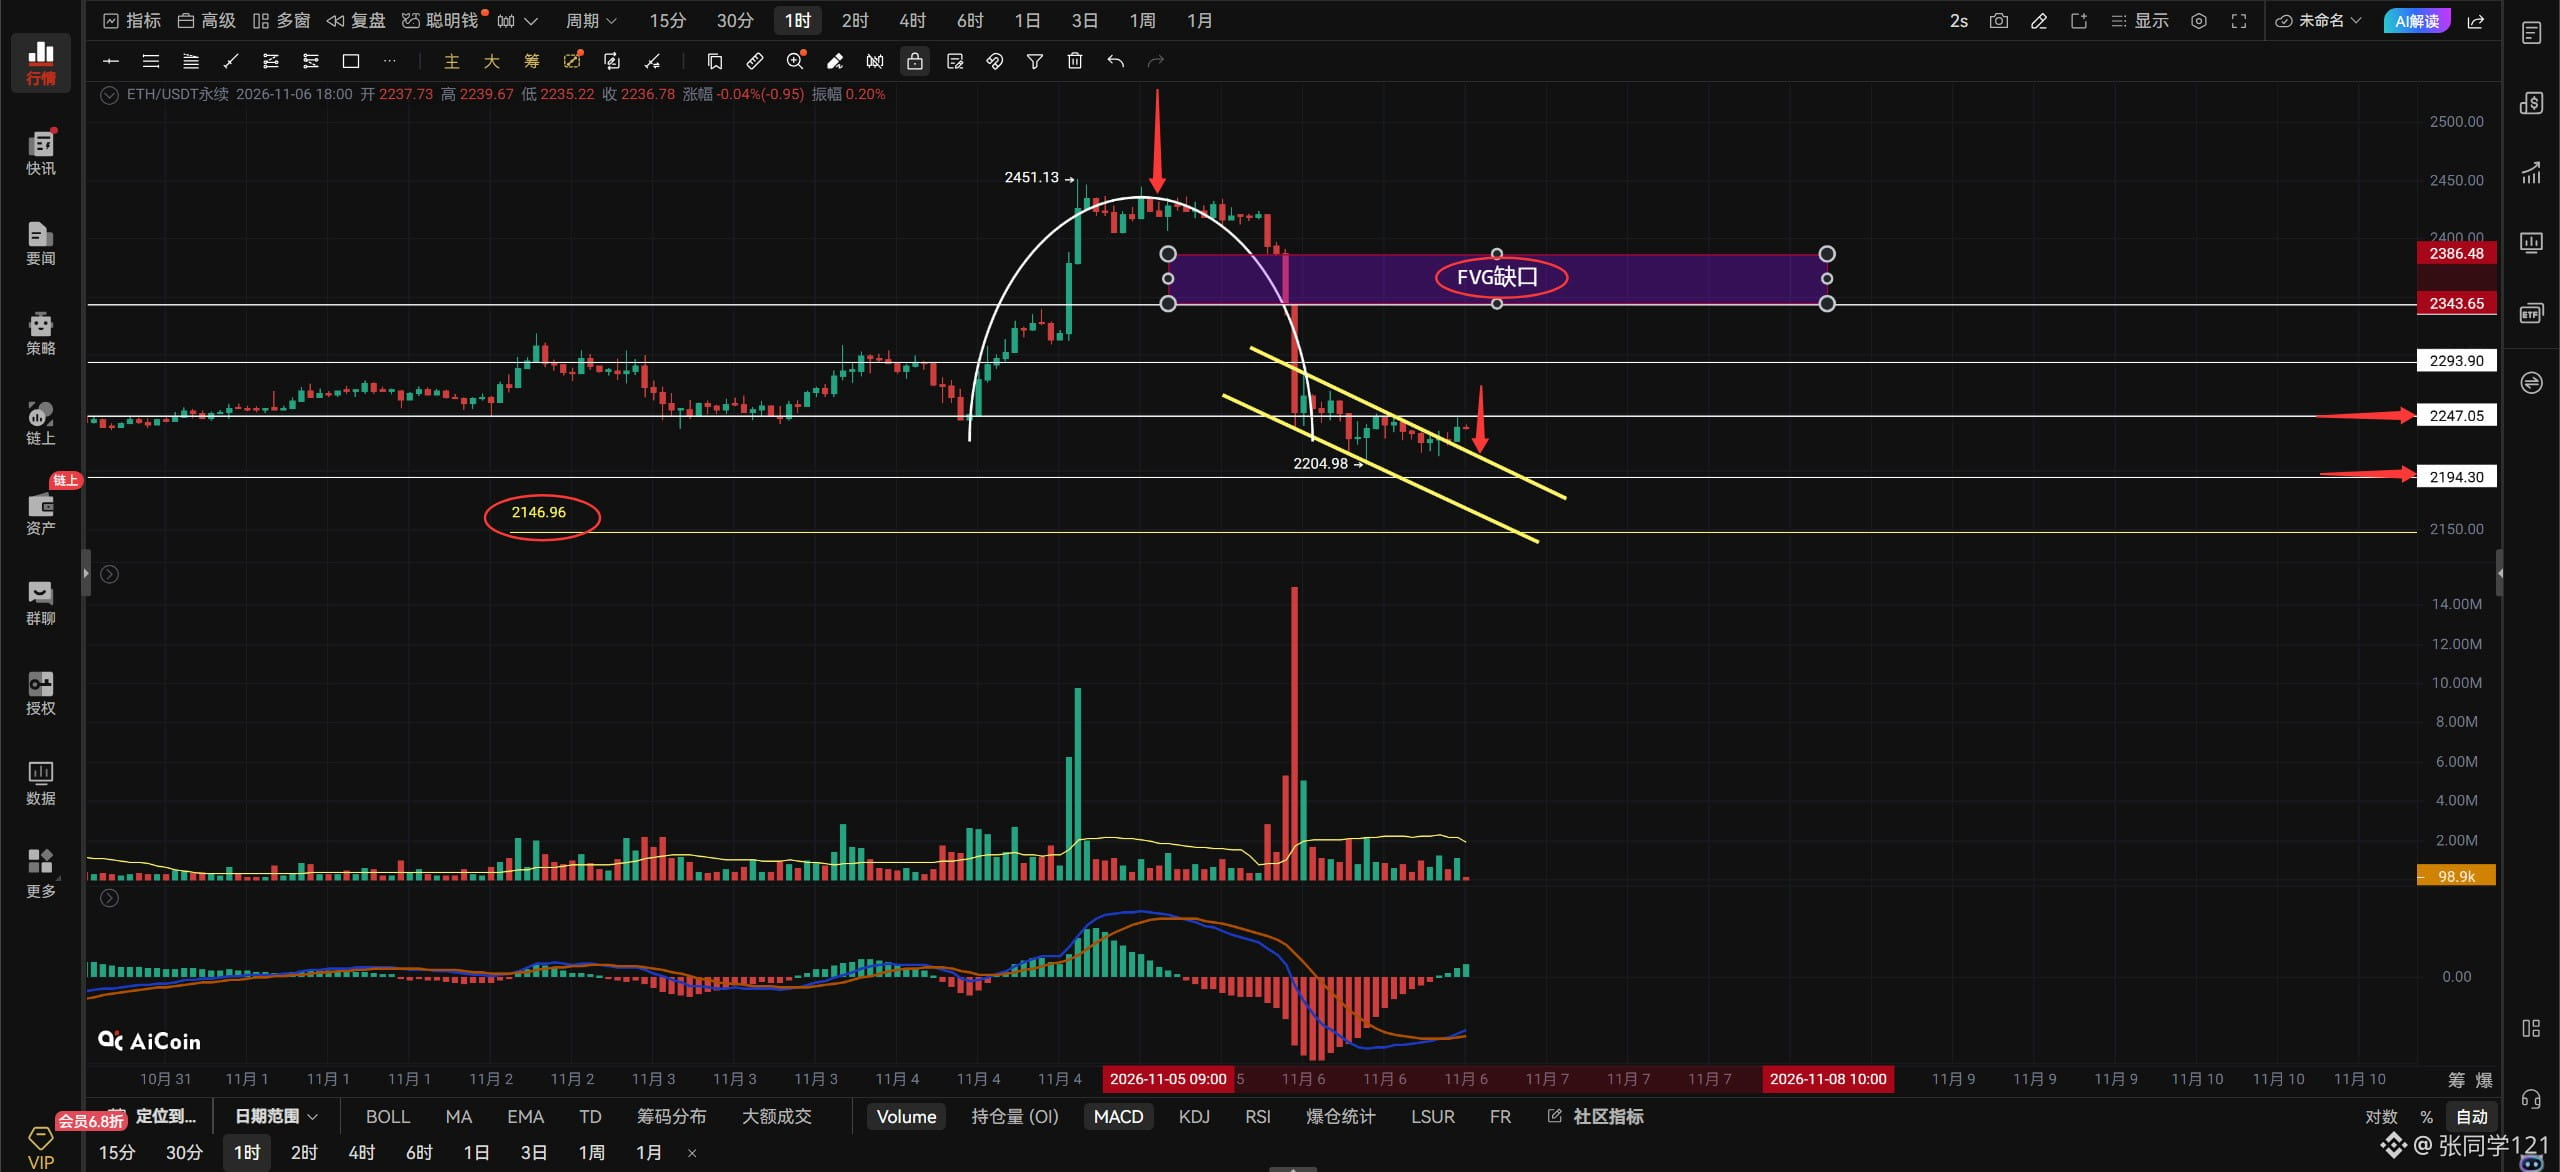
ETH had already shifted from a bearish to a bullish trend on the hourly timeframe yesterday, but then it got knocked right back where it started. Do you like this kind of high-level pump-and-retrace? I don't, but I can't change it, so I can only accept it. ETH has drawn a big door. Remember, in a downtrend, there is no such thing as support: every support level is there to be broken. Don't pin your hopes on any support; it just comes down to whether price wants to fall or not. After drawing its door, ETH formed a cup-and-handle pattern. Taken by itself, this pattern is a bullish flag, so ETH is currently bouncing. Although the cup-and-handle pattern is bullish, it won't mean much unless price can break above the resistance at 2247. It may just continue consolidating between 2247 and 2194. A break above 2247 would extend the bounce, with the next resistance at 2293. An FVG gap has appeared overhead on ETH's hourly chart, between 2386 and 2343. If ETH can break above 2247 on the hourly timeframe and stay above it, it may have a chance to fill that FVG gap. I don't know exactly when it will be filled, but I want to tell you that if you entered a long early, you can hold it until near the FVG gap, as long as price doesn't break below the previous low. Whether it gets filled today or tomorrow remains to be seen.
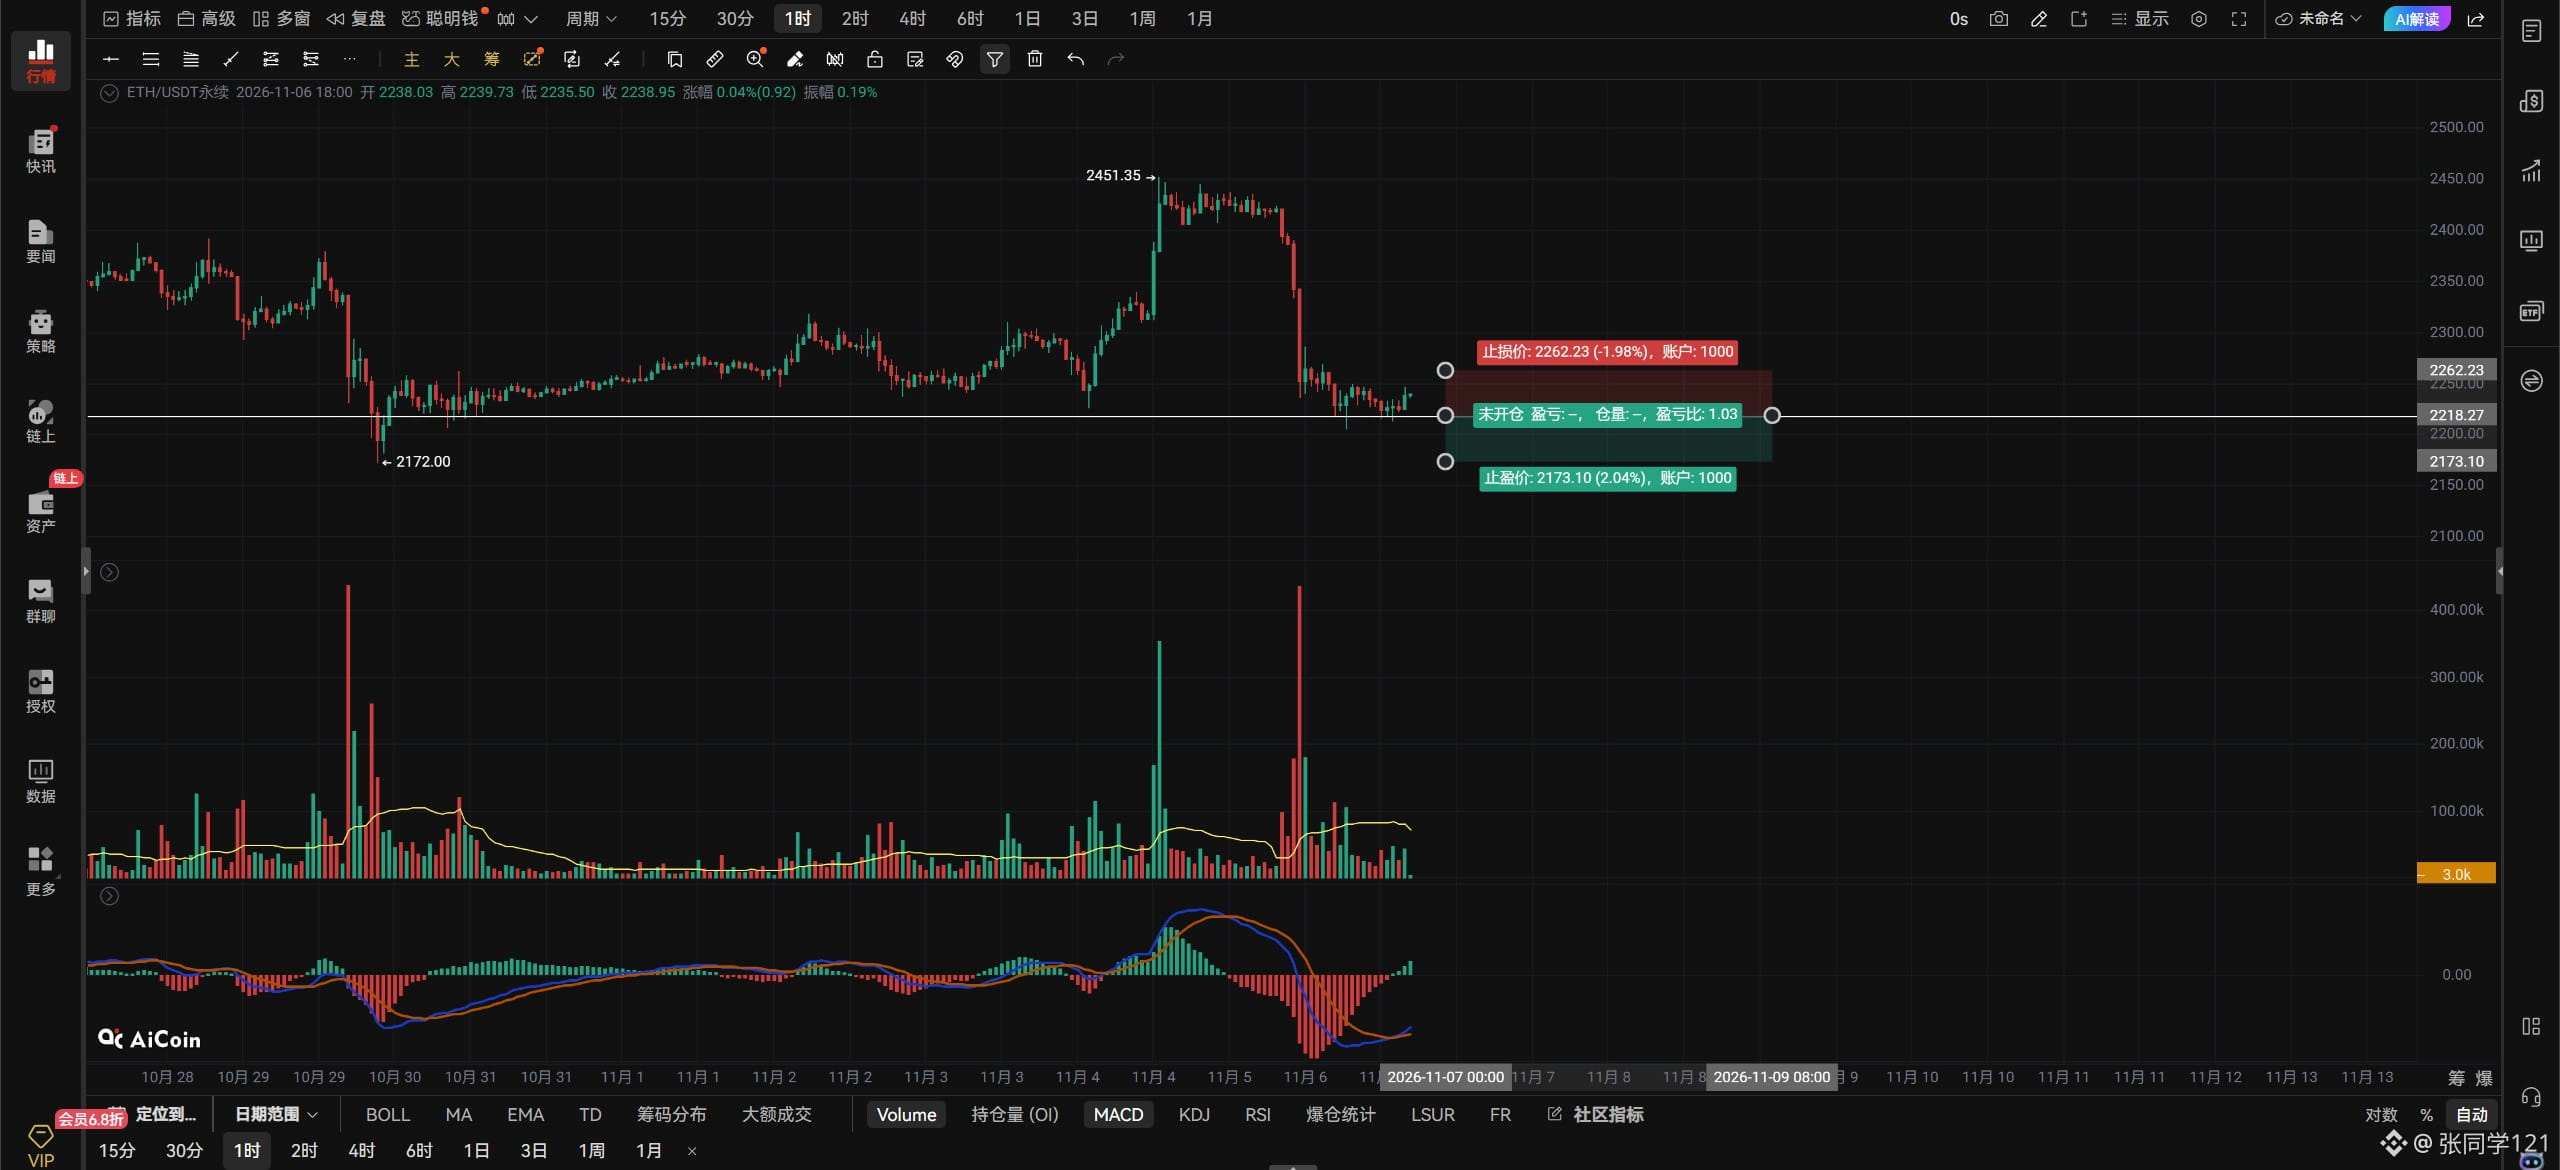
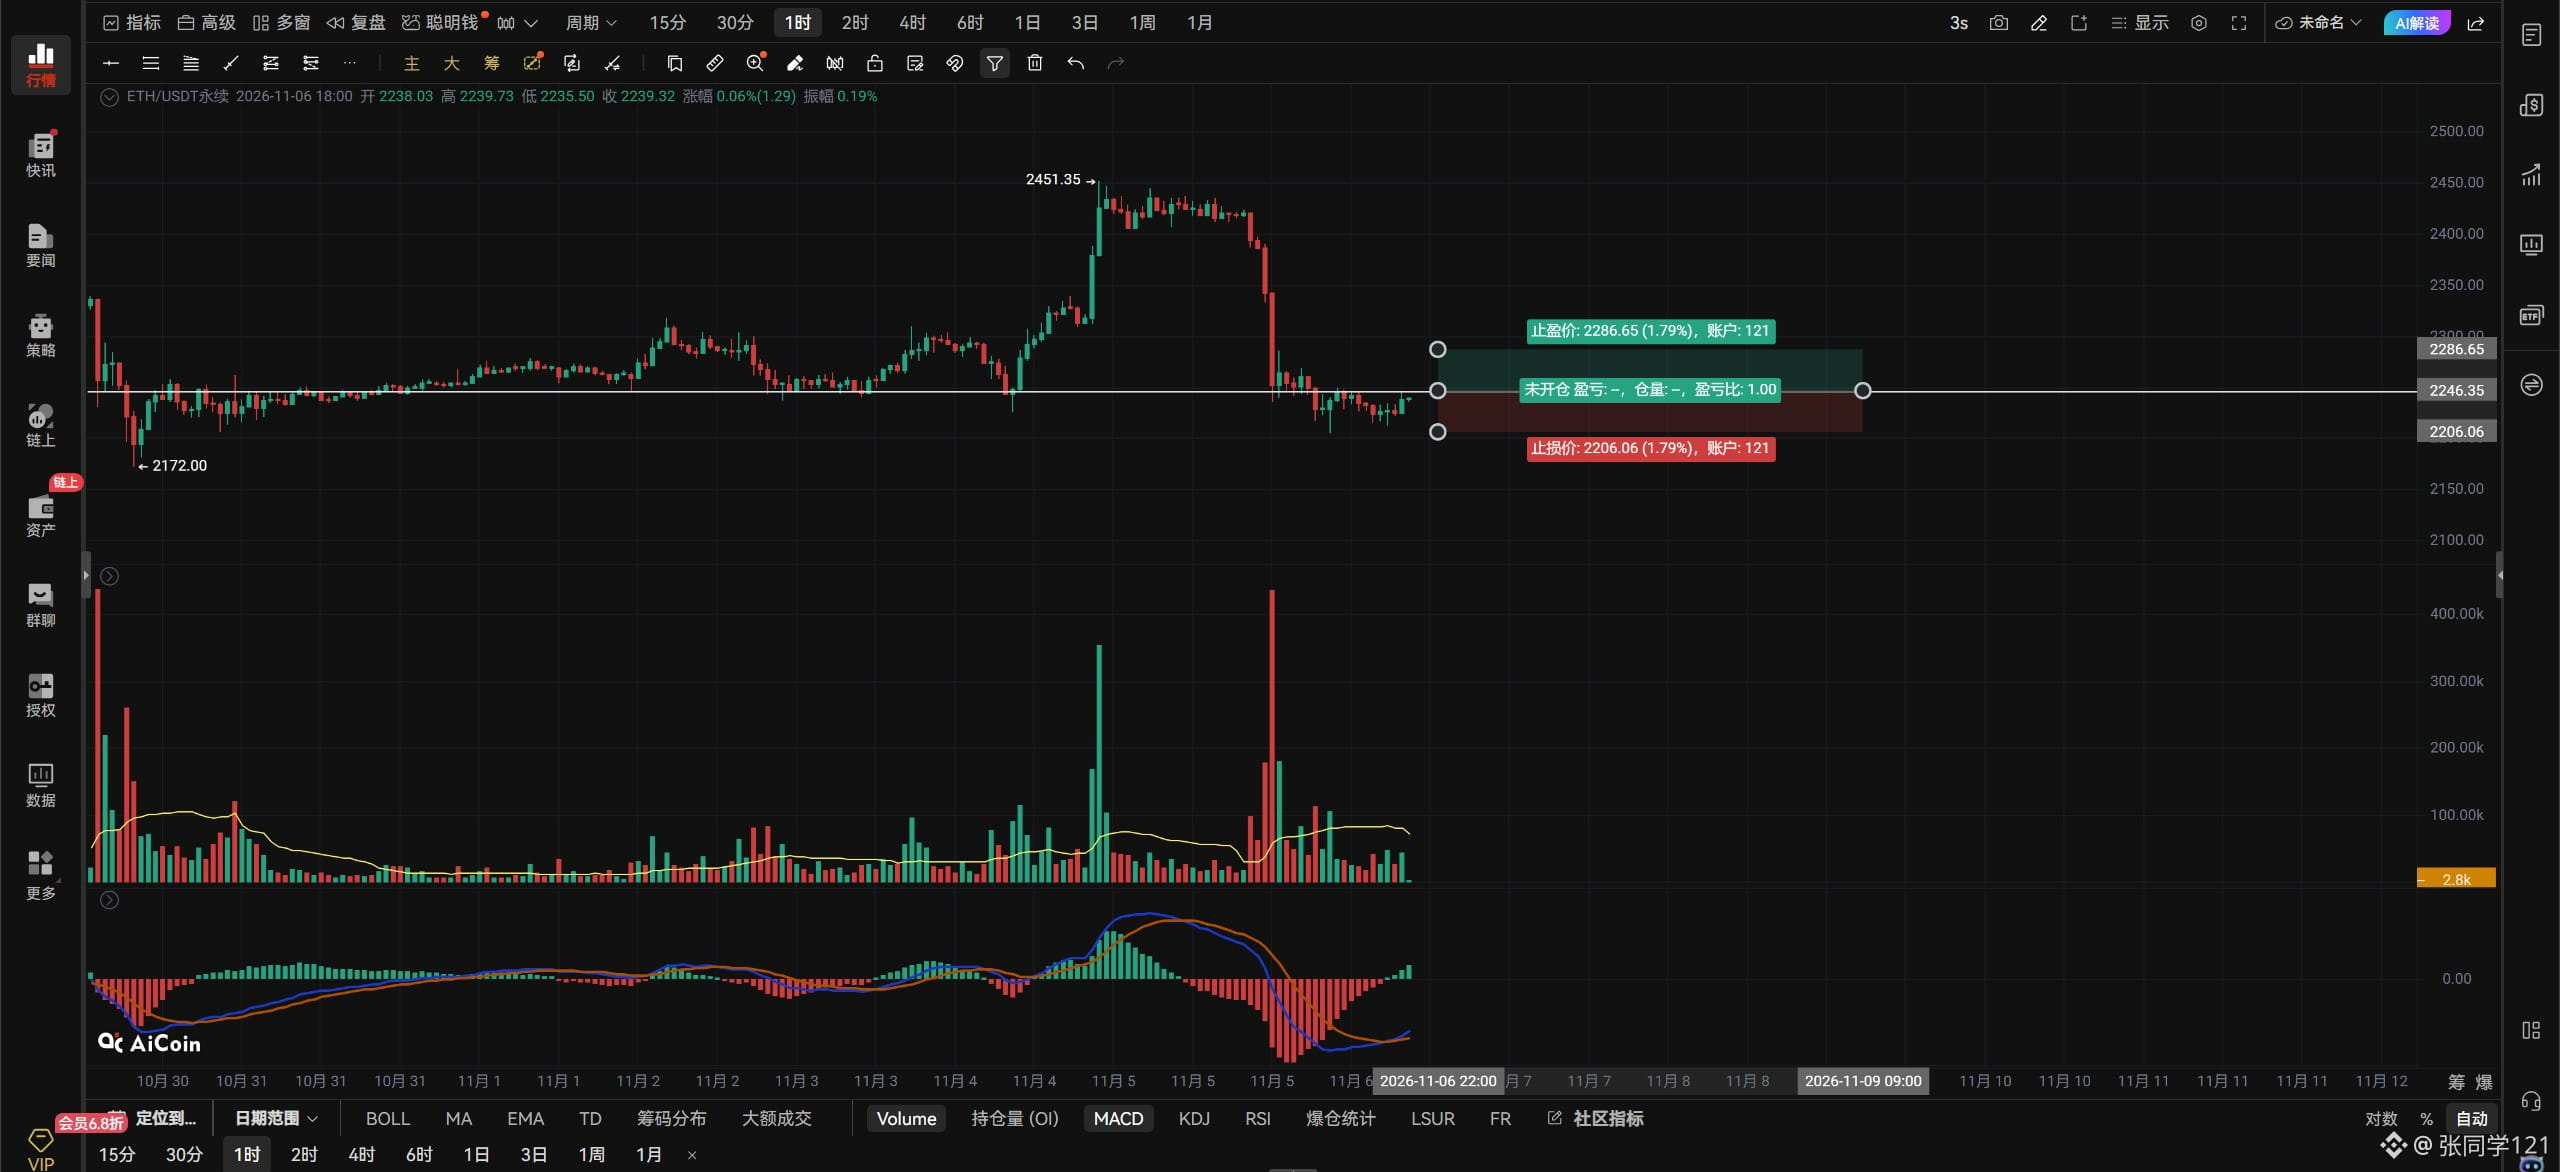
If ETH breaks above 2246 with strong volume, consider entering a long on the breakout; if it breaks below 2218 with strong volume, consider entering a short. Watch for changes in volume and use a stop-loss.
If ETH holds above 2246 on the hourly timeframe, look for 2293–2342.
If it breaks below 2218 on the 4-hour timeframe, look down to 2171–2146.
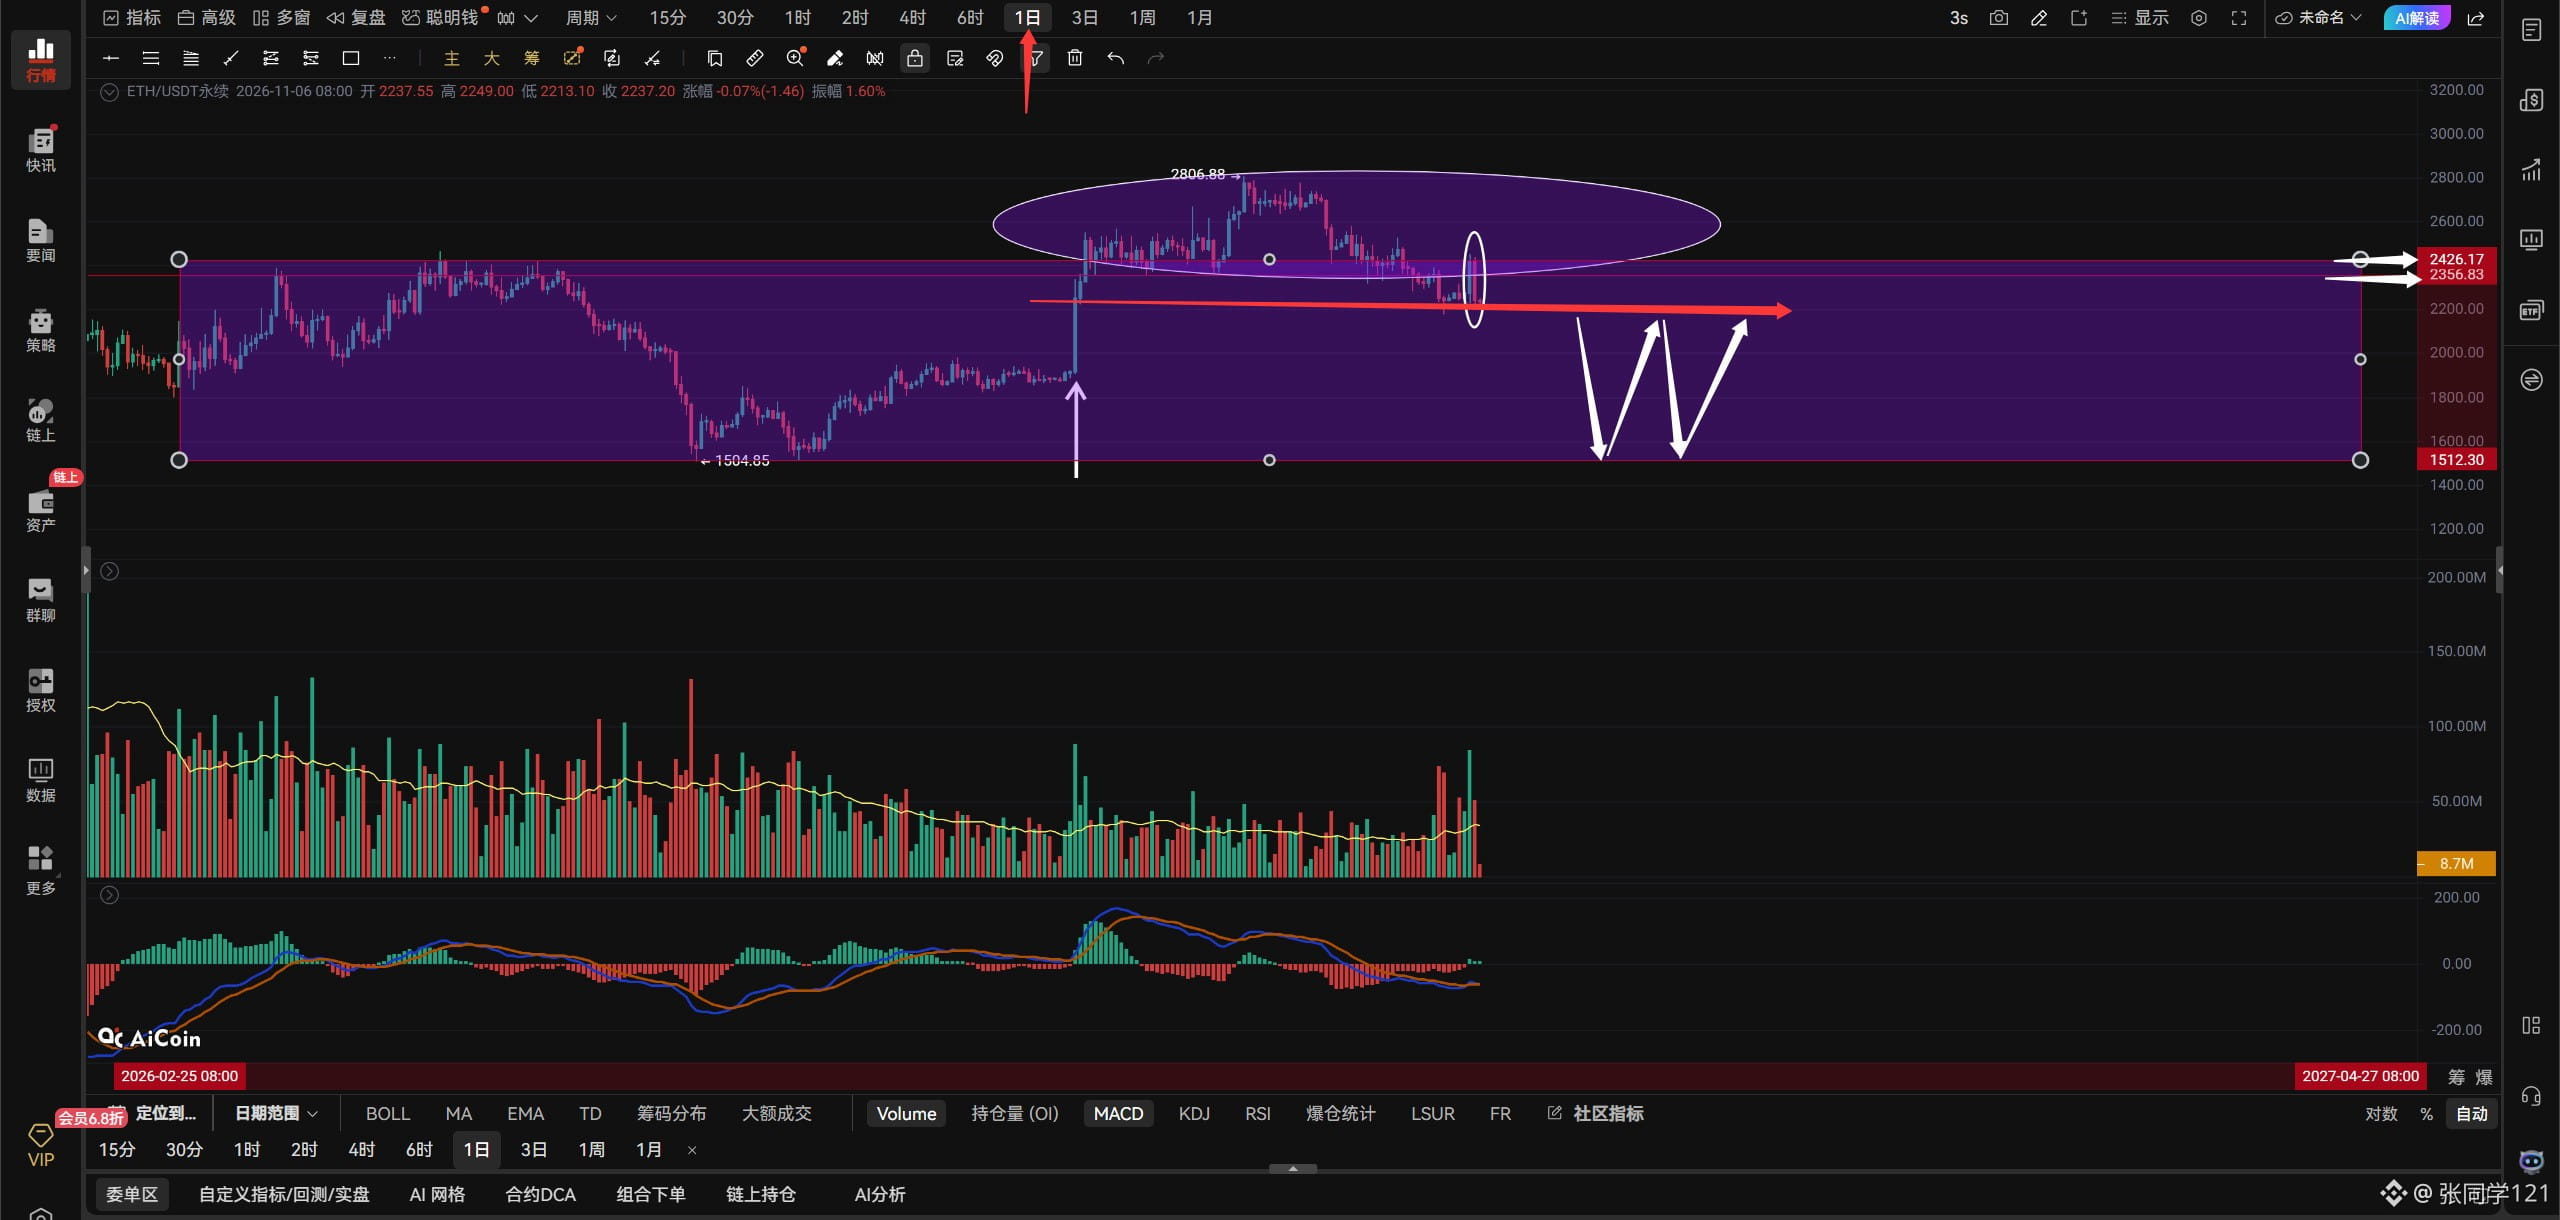
On the daily chart, ETH has given back all of yesterday's gains and formed a bearish engulfing pattern inside the white box. This is not a good pattern: a bearish pattern on the daily timeframe indicates a need for a pullback. Price has also broken below the lower boundary of the large white-box consolidation range at 2356. For now, I just hope ETH doesn't fall into the large bullish candle below, marked by the white arrow. If price falls back into that candle, everything below is within ETH's potential downside range, which is pretty frightening. For ETH to stop falling on the daily timeframe, it must get back above 2356. For a daily-timeframe bounce, it must break above 2426; otherwise, it won't mean much. That's all.
$ETH
#币安将恢复更多资产提现
ETH had already shifted from a bearish to a bullish trend on the hourly timeframe yesterday, but then it got knocked right back where it started. Do you like this kind of high-level pump-and-retrace? I don't, but I can't change it, so I can only accept it. ETH has drawn a big door. Remember, in a downtrend, there is no such thing as support: every support level is there to be broken. Don't pin your hopes on any support; it just comes down to whether price wants to fall or not. After drawing its door, ETH formed a cup-and-handle pattern. Taken by itself, this pattern is a bullish flag, so ETH is currently bouncing. Although the cup-and-handle pattern is bullish, it won't mean much unless price can break above the resistance at 2247. It may just continue consolidating between 2247 and 2194. A break above 2247 would extend the bounce, with the next resistance at 2293. An FVG gap has appeared overhead on ETH's hourly chart, between 2386 and 2343. If ETH can break above 2247 on the hourly timeframe and stay above it, it may have a chance to fill that FVG gap. I don't know exactly when it will be filled, but I want to tell you that if you entered a long early, you can hold it until near the FVG gap, as long as price doesn't break below the previous low. Whether it gets filled today or tomorrow remains to be seen.
If ETH breaks above 2246 with strong volume, consider entering a long on the breakout; if it breaks below 2218 with strong volume, consider entering a short. Watch for changes in volume and use a stop-loss.
If ETH holds above 2246 on the hourly timeframe, look for 2293–2342.
If it breaks below 2218 on the 4-hour timeframe, look down to 2171–2146.
On the daily chart, ETH has given back all of yesterday's gains and formed a bearish engulfing pattern inside the white box. This is not a good pattern: a bearish pattern on the daily timeframe indicates a need for a pullback. Price has also broken below the lower boundary of the large white-box consolidation range at 2356. For now, I just hope ETH doesn't fall into the large bullish candle below, marked by the white arrow. If price falls back into that candle, everything below is within ETH's potential downside range, which is pretty frightening. For ETH to stop falling on the daily timeframe, it must get back above 2356. For a daily-timeframe bounce, it must break above 2426; otherwise, it won't mean much. That's all.
$ETH
#币安将恢复更多资产提现