ETH at $2,240: are you cutting your losses or adding to your position?
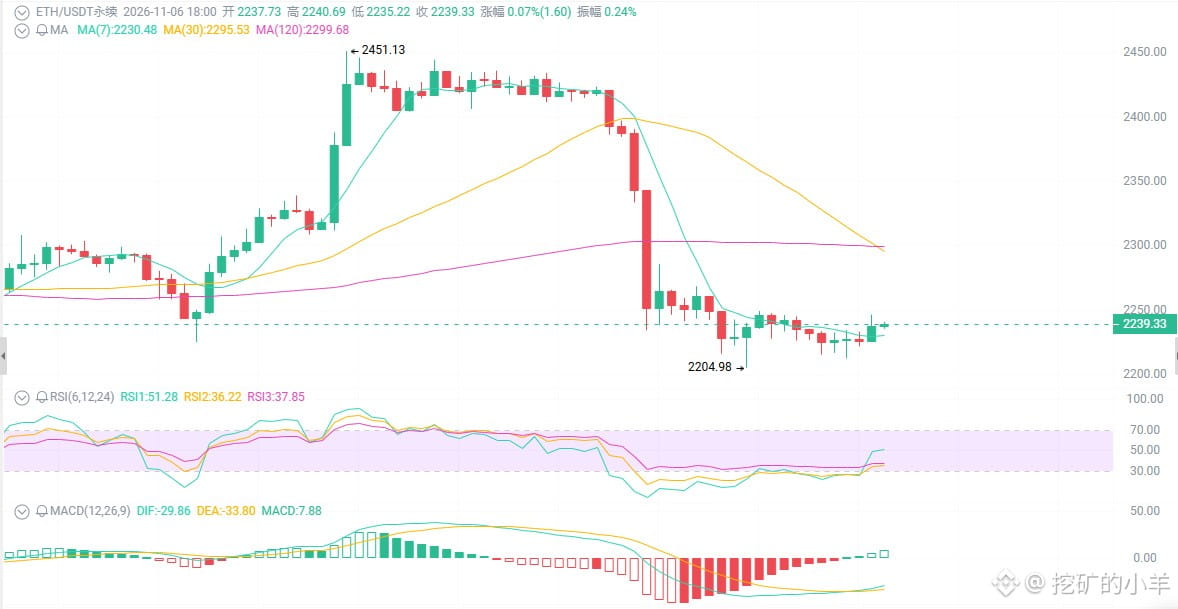
Nearly $100 million in ETF outflows in a single day, $200 million in leveraged long liquidations, a drag from the U.S. tech stock sell-off, and the Fear & Greed Index down to 28—but just moments ago, after plunging from $2,420 to $2,206, ETH clawed its way back to $2,240, with the 200-day moving average still holding firm. Was this the final drop as sentiment gets flushed out, or the official start of a bear market?
First, the surface picture: bad news is piling on, but the price hasn't collapsed.
ETH fell 7–8% in 24 hours, plunging straight from its intraday high of $2,420 to $2,206. Altcoins fell even harder. The Fear & Greed Index is at 28–38, in fear territory. BTC has also retreated to $76,000, and Bitcoin dominance is at 59%—all the money is hiding in Bitcoin. But have you noticed? ETH has tested the $2,200 level several times, and each time it's been pulled back up. The 200-day moving average is at $2,150–$2,160, RSI at 39–40 is nearing oversold territory, and MACD is bearish but flattening out. The drop is steep, but the floor hasn't given way.
First: ETFs are seeing outflows and leverage is getting liquidated, but buyers are stepping in.
On November 5, U.S. spot ETH ETFs saw nearly $100 million in net outflows in a single day, with BlackRock's ETHA accounting for most of it. Leveraged long liquidations were in the $200 million range.
Sounds like the end of the world? But look at the price—it hasn't broken below $2,200.
Amundi, Europe's largest asset manager, has a tokenized equity index fund on Ethereum; corporate player BitMine's holdings are approaching a certain share of supply; and at Devcon, the Lean Ethereum roadmap extended out to 2029.
Second: you're panicking over the charts, but ETH's fundamentals haven't collapsed at all.
The staking rate is 36%, locking up supply. DeFi TVL is $43 billion, stablecoin market cap is $136 billion and dominant, while RWA and tokenized assets continue to grow. Daily trading volume and active addresses remain high.
ETH isn't a meme coin—it's the foundation for smart contracts and tokenization infrastructure. The price has fallen, but the number of users hasn't, the amount of ETH locked up hasn't, and institutional participation hasn't either.
When price and fundamentals diverge, which should you trust? In March 2020, ETH fell to $80, and its fundamentals hadn't “collapsed” either. Later, it climbed to $4,800.
Third: today's jobs report is the real judge.
The Federal Reserve's interest rate is 3.75%–4.00%, and the odds of a December rate hike aren't low. CPI is running hot, real interest rates are high, and the dollar is strong. The macro environment is unfriendly to risk assets.
But today's (November 6) nonfarm payrolls report is the key to the short-term direction.
Strong data → Hawkish expectations strengthen → ETH could test $2,200 again or even break below it
Weak data → Rate-cut expectations rise → Rebound to $2,280–$2,350
Nearly $100 million in ETF outflows in a single day, $200 million in leveraged long liquidations, a drag from the U.S. tech stock sell-off, and the Fear & Greed Index down to 28—but just moments ago, after plunging from $2,420 to $2,206, ETH clawed its way back to $2,240, with the 200-day moving average still holding firm. Was this the final drop as sentiment gets flushed out, or the official start of a bear market?
First, the surface picture: bad news is piling on, but the price hasn't collapsed.
ETH fell 7–8% in 24 hours, plunging straight from its intraday high of $2,420 to $2,206. Altcoins fell even harder. The Fear & Greed Index is at 28–38, in fear territory. BTC has also retreated to $76,000, and Bitcoin dominance is at 59%—all the money is hiding in Bitcoin. But have you noticed? ETH has tested the $2,200 level several times, and each time it's been pulled back up. The 200-day moving average is at $2,150–$2,160, RSI at 39–40 is nearing oversold territory, and MACD is bearish but flattening out. The drop is steep, but the floor hasn't given way.
First: ETFs are seeing outflows and leverage is getting liquidated, but buyers are stepping in.
On November 5, U.S. spot ETH ETFs saw nearly $100 million in net outflows in a single day, with BlackRock's ETHA accounting for most of it. Leveraged long liquidations were in the $200 million range.
Sounds like the end of the world? But look at the price—it hasn't broken below $2,200.
Amundi, Europe's largest asset manager, has a tokenized equity index fund on Ethereum; corporate player BitMine's holdings are approaching a certain share of supply; and at Devcon, the Lean Ethereum roadmap extended out to 2029.
Second: you're panicking over the charts, but ETH's fundamentals haven't collapsed at all.
The staking rate is 36%, locking up supply. DeFi TVL is $43 billion, stablecoin market cap is $136 billion and dominant, while RWA and tokenized assets continue to grow. Daily trading volume and active addresses remain high.
ETH isn't a meme coin—it's the foundation for smart contracts and tokenization infrastructure. The price has fallen, but the number of users hasn't, the amount of ETH locked up hasn't, and institutional participation hasn't either.
When price and fundamentals diverge, which should you trust? In March 2020, ETH fell to $80, and its fundamentals hadn't “collapsed” either. Later, it climbed to $4,800.
Third: today's jobs report is the real judge.
The Federal Reserve's interest rate is 3.75%–4.00%, and the odds of a December rate hike aren't low. CPI is running hot, real interest rates are high, and the dollar is strong. The macro environment is unfriendly to risk assets.
But today's (November 6) nonfarm payrolls report is the key to the short-term direction.
Strong data → Hawkish expectations strengthen → ETH could test $2,200 again or even break below it
Weak data → Rate-cut expectations rise → Rebound to $2,280–$2,350