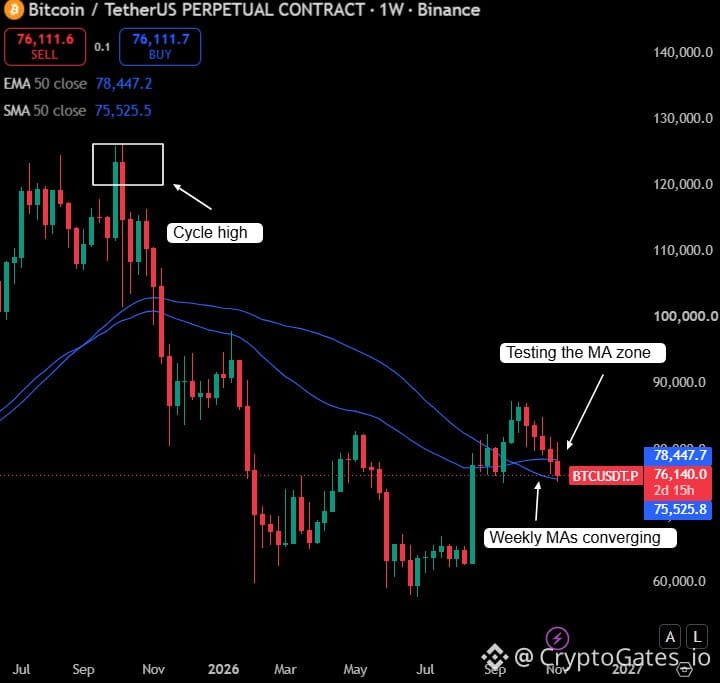
$BTC is testing the weekly MA zone: what the chart actually says
BTC trades near 76,140 on the weekly chart, sitting between the 50 EMA (78,448) and the 50 SMA (75,526). This week’s candle is down 2.77% so far, with a high of 81,188 and a low of 75,158.
A few points worth separating:
Touching a moving average is a retest, not a confirmation.
The weekly candle is still open, so the signal is not final until the close.
When price compresses between two averages, a decisive move usually follows, but the direction is not given by the chart alone.
Scenario map:
Weekly close above the SMA: structure holds, the EMA becomes the next test.
Weekly close below the SMA: the support thesis weakens and risk management matters more than opinions.
A practical way to use this: define your invalidation level before entering, size positions so one wrong call does not hurt, and backtest the rule on historical weekly data instead of trusting a single chart.
Verify first. Risk later. Scale slowly...
#BTC #BinanceSquare
BTC trades near 76,140 on the weekly chart, sitting between the 50 EMA (78,448) and the 50 SMA (75,526). This week’s candle is down 2.77% so far, with a high of 81,188 and a low of 75,158.
A few points worth separating:
Touching a moving average is a retest, not a confirmation.
The weekly candle is still open, so the signal is not final until the close.
When price compresses between two averages, a decisive move usually follows, but the direction is not given by the chart alone.
Scenario map:
Weekly close above the SMA: structure holds, the EMA becomes the next test.
Weekly close below the SMA: the support thesis weakens and risk management matters more than opinions.
A practical way to use this: define your invalidation level before entering, size positions so one wrong call does not hurt, and backtest the rule on historical weekly data instead of trusting a single chart.
Verify first. Risk later. Scale slowly...
#BTC #BinanceSquare