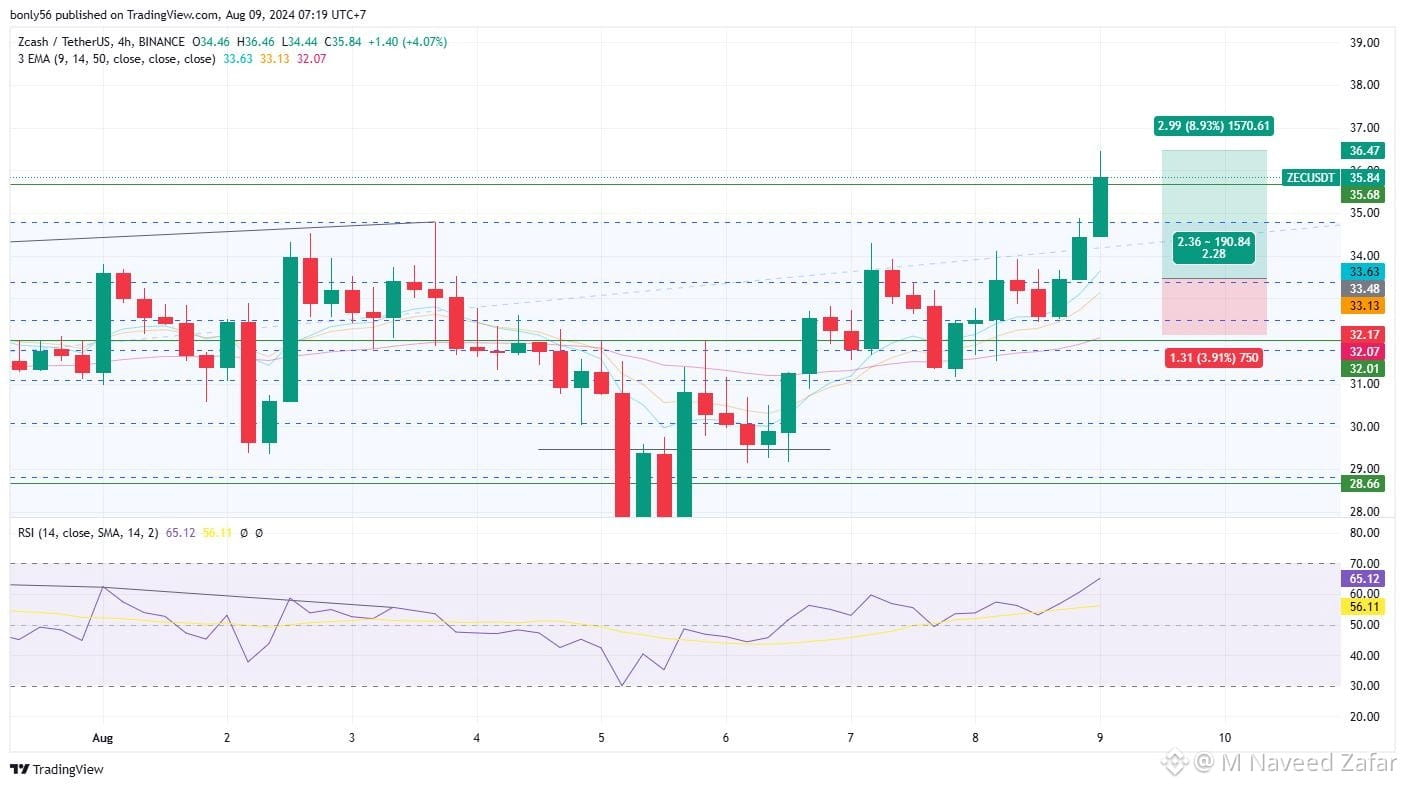
🚨 ZCASH (ZEC) PRICE ANALYSIS: BEARS ARE APPLYING PRESSURE — WHAT COMES NEXT?
Zcash ($ZEC ) is showing short-term weakness on the Binance spot market. Traders are now watching whether buyers can defend the recent intraday support zone.
📊 BINANCE MARKET SNAPSHOT
Trading Pair: ZEC/USDT
Price: 1,275.89 USDT
24H Change: -2.91%
24H Volume: 210,860 ZEC
Daily High: 1,333.34 USDT
Daily Low: 1,271.27 USDT
🔍 TECHNICAL ANALYSIS
1️⃣ SUPPORT ZONES
The 1,271–1,275 area is the immediate support region based on recent trading activity.
If sellers push price below this zone and it fails to recover, downside pressure could increase.
A deeper reference area is around 1,221.
2️⃣ RESISTANCE ZONES
The first area to watch is 1,281–1,285.
The stronger resistance zone is around 1,330–1,335.
A convincing breakout above resistance, supported by trading volume, could improve the bullish outlook.
3️⃣ RSI, EMA & VOLUME
RSI: Monitor whether momentum moves out of oversold territory or remains weak.
EMA: Watch the 20 EMA and 50 EMA for trend direction and potential confirmation.
Volume: A breakdown with increasing selling volume would strengthen the bearish case. Increasing buying volume during a recovery would support a possible reversal.
If ZEC holds above immediate support and buyers reclaim the 1,281–1,285 region, a recovery towards the 1,330–1,335 resistance area becomes possible.
📉 BEARISH SCENARIO
If ZEC loses 1,271 with strong selling pressure, the next downside reference is around 1,221.
⚡ MY TRADING VIEW
At the moment, I would prefer waiting for confirmation rather than entering blindly
Capital protection matters more than chasing every market movement
💬 YOUR OPINION MATTERS
What is your expectation for ZEC?
🟢 Bullish — Recovery towards 1,330+
🔴 Bearish — Breakdown below 1,271
🟡 Neutral — Consolidation before the next move
Share your analysis in the comments!
Follow for more daily cryptocurrency market analysis.
$ZEC $BTC C $ETH #Zcash #CryptoAnalysis #BinanceSquare #TechnicalAnalysis #CryptoTrading
Educational market analysis only.
Zcash ($ZEC ) is showing short-term weakness on the Binance spot market. Traders are now watching whether buyers can defend the recent intraday support zone.
📊 BINANCE MARKET SNAPSHOT
Trading Pair: ZEC/USDT
Price: 1,275.89 USDT
24H Change: -2.91%
24H Volume: 210,860 ZEC
Daily High: 1,333.34 USDT
Daily Low: 1,271.27 USDT
🔍 TECHNICAL ANALYSIS
1️⃣ SUPPORT ZONES
The 1,271–1,275 area is the immediate support region based on recent trading activity.
If sellers push price below this zone and it fails to recover, downside pressure could increase.
A deeper reference area is around 1,221.
2️⃣ RESISTANCE ZONES
The first area to watch is 1,281–1,285.
The stronger resistance zone is around 1,330–1,335.
A convincing breakout above resistance, supported by trading volume, could improve the bullish outlook.
3️⃣ RSI, EMA & VOLUME
RSI: Monitor whether momentum moves out of oversold territory or remains weak.
EMA: Watch the 20 EMA and 50 EMA for trend direction and potential confirmation.
Volume: A breakdown with increasing selling volume would strengthen the bearish case. Increasing buying volume during a recovery would support a possible reversal.
If ZEC holds above immediate support and buyers reclaim the 1,281–1,285 region, a recovery towards the 1,330–1,335 resistance area becomes possible.
📉 BEARISH SCENARIO
If ZEC loses 1,271 with strong selling pressure, the next downside reference is around 1,221.
⚡ MY TRADING VIEW
At the moment, I would prefer waiting for confirmation rather than entering blindly
Capital protection matters more than chasing every market movement
💬 YOUR OPINION MATTERS
What is your expectation for ZEC?
🟢 Bullish — Recovery towards 1,330+
🔴 Bearish — Breakdown below 1,271
🟡 Neutral — Consolidation before the next move
Share your analysis in the comments!
Follow for more daily cryptocurrency market analysis.
$ZEC $BTC C $ETH #Zcash #CryptoAnalysis #BinanceSquare #TechnicalAnalysis #CryptoTrading
Educational market analysis only.