
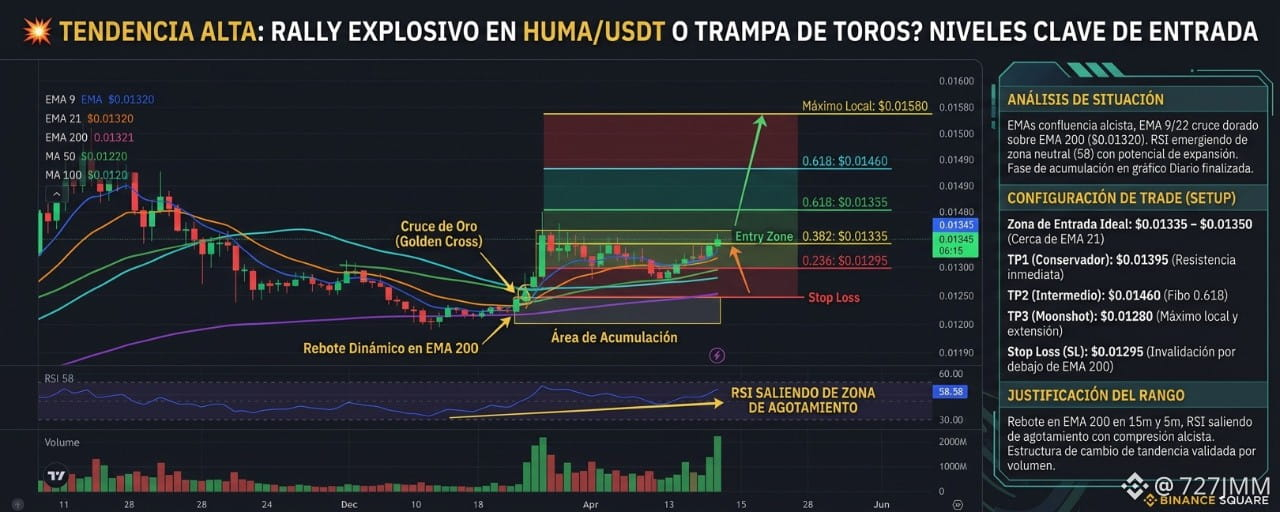


HUMA/USDT shows a clean recovery structure after testing the psychological zone at $0.01345. The confluence of technical indicators points to strong buying momentum on shorter timeframes (5m/15m), supported by the daily chart.
Technical Situation Analysis
EMA & MA: On the 5m and 15m charts, we observe an earlier golden cross between the EMA 9 and EMA 21, with price holding above the EMA 200 ($0.01320), which acts as strong dynamic support. On the daily chart, the MA 50 and MA 100 are consolidating a solid accumulation base.
RSI & Volume: The RSI on the 15-minute chart is at 58, emerging from the neutral exhaustion zone without yet showing overbought conditions, leaving room for further expansion. Volume confirms the move's validity, with bullish candles showing a wider range.
Structure: We are at the end of an accumulation phase, breaking through the 0.382 Fibonacci retracement toward a bullish change of structure.
Trade Setup (High-Confluence Setup)
Entry Zone: $0.01335 – $0.01350 (Near the 21 EMA retest)
TP1 (Conservative): $0.01395 (Immediate resistance on the 15-minute chart)
TP2 (Intermediate): $0.01460 (0.618 Fibonacci level)
TP3 (Moonshot): $0.01580 (Local high and range extension)
Stop Loss (SL): $0.01295 (Invalidation below the 200 EMA and the 0.236 Fibonacci level)
Trade Range Rationale
The entry aims to capitalize on the dynamic bounce off the 200 EMA on the 15-minute chart, alongside the RSI exiting the consolidation area. The convergence of moving averages signals institutional volume accumulation, poised to drive the price toward the next major resistance.
Manage your risk responsibly.