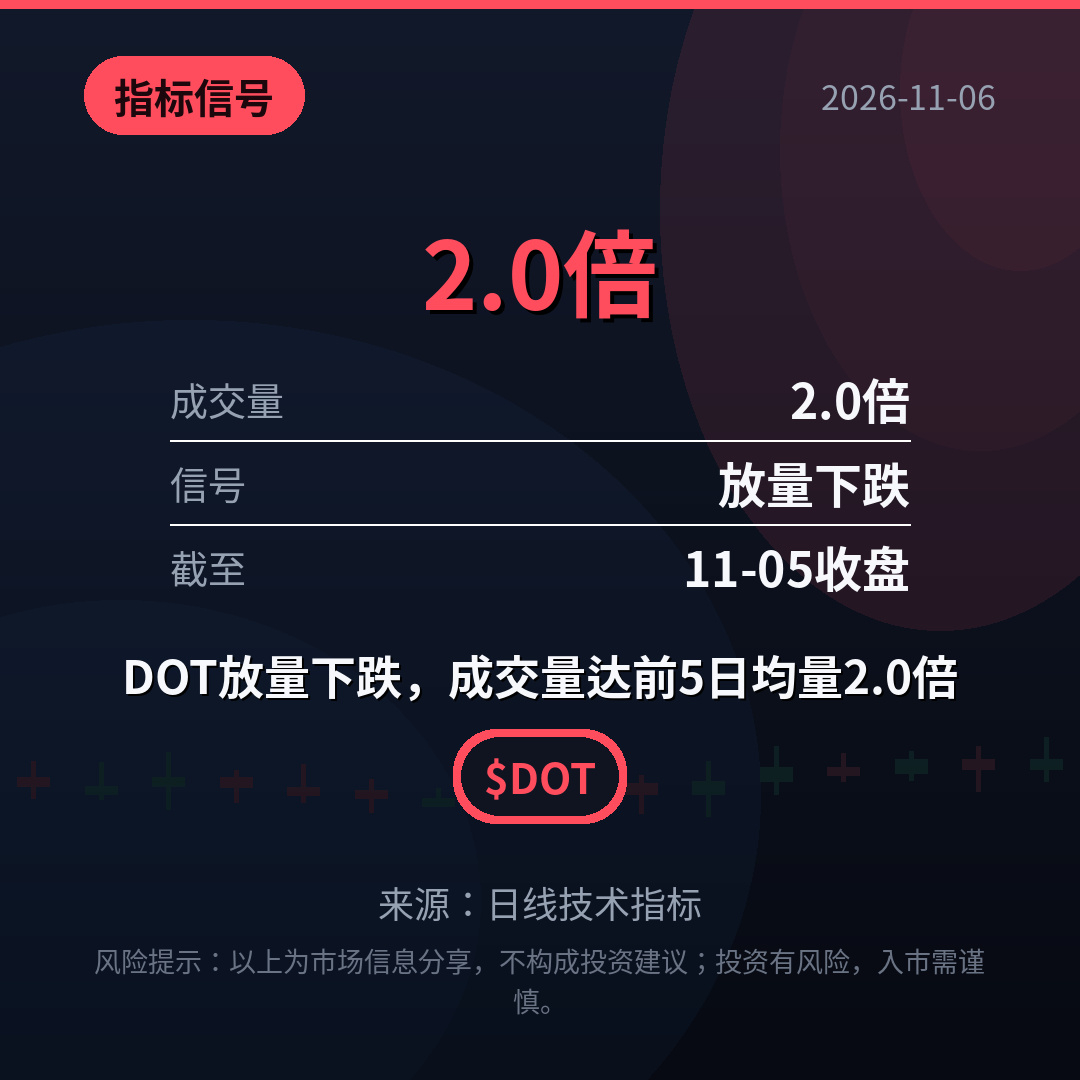
【Indicator Signal】DOT falls on high volume, with trading volume reaching 2.0 times the average of the previous 5 days
DOT’s daily chart shows a high-volume decline signal: as of the close on November 5, trading volume reached 2.0 times the average of the previous 5 days, indicating a clear increase in selling pressure. A high-volume decline usually means bears are selling heavily in a concentrated move, so beware of further short-term downside momentum. If trading volume later falls back to around its average and the price stabilizes, the signal will be invalidated. What do you think DOT will do next?
$DOT $BTC $ETH
#币安广场 #DOT #Polkadot
(Source: daily technical indicators)
⚠️Risk warning: The above is shared for informational purposes only and does not constitute investment advice. Investing involves risks; proceed with caution.
DOT’s daily chart shows a high-volume decline signal: as of the close on November 5, trading volume reached 2.0 times the average of the previous 5 days, indicating a clear increase in selling pressure. A high-volume decline usually means bears are selling heavily in a concentrated move, so beware of further short-term downside momentum. If trading volume later falls back to around its average and the price stabilizes, the signal will be invalidated. What do you think DOT will do next?
$DOT $BTC $ETH
#币安广场 #DOT #Polkadot
(Source: daily technical indicators)
⚠️Risk warning: The above is shared for informational purposes only and does not constitute investment advice. Investing involves risks; proceed with caution.