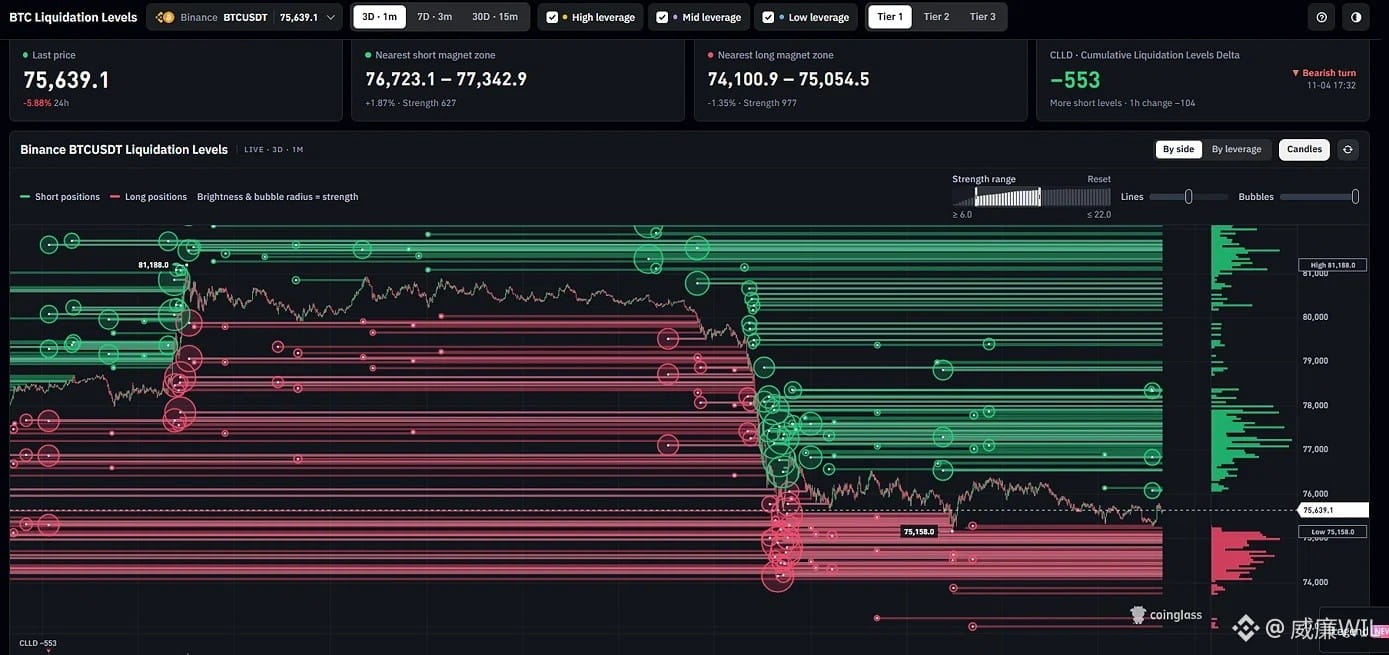
📊 BTC Liquidation Heatmap Analysis (3D Level)
📍 Current market: #清算地图
Current price $75,639, down 5.88% over 24 hours. The price has broken below the previous consolidation range and is now looking for new support.
📉 Key data (CLLD indicator):
- CLLD (Cumulative Liquidation Level Delta): -553, showing a “Bearish turn.” This means bears have the upper hand in the short term, and the market is liquidating longs at higher levels.
🎯 Key liquidation zones (liquidation points):
1. 👇 Strong support below / long liquidation zone (red zone): $74,100 - $75,054
- Strength: 977 (very strong!)
- Analysis: This is the nearest dense long liquidation zone to the current price. Notice the rows of large red circles below the chart: if the price falls below 75,000 or even 74,100, it could trigger a large-scale cascade of long liquidations, accelerating the drop with a sharp downward wick. This is also a favorite stop-hunting target for large players.
2. ☝️ Resistance above / short liquidation zone (green zone): $76,723 - $77,342
- Strength: 627 (weaker than below)
- Analysis: There are some leveraged shorts above the current price. If the market rebounds, it could rise as high as the 76,700 - 77,300 area to liquidate these highly leveraged short positions. However, overall, there is strong resistance overhead (the green lines run through a dense cluster).
📍 Current market: #清算地图
Current price $75,639, down 5.88% over 24 hours. The price has broken below the previous consolidation range and is now looking for new support.
📉 Key data (CLLD indicator):
- CLLD (Cumulative Liquidation Level Delta): -553, showing a “Bearish turn.” This means bears have the upper hand in the short term, and the market is liquidating longs at higher levels.
🎯 Key liquidation zones (liquidation points):
1. 👇 Strong support below / long liquidation zone (red zone): $74,100 - $75,054
- Strength: 977 (very strong!)
- Analysis: This is the nearest dense long liquidation zone to the current price. Notice the rows of large red circles below the chart: if the price falls below 75,000 or even 74,100, it could trigger a large-scale cascade of long liquidations, accelerating the drop with a sharp downward wick. This is also a favorite stop-hunting target for large players.
2. ☝️ Resistance above / short liquidation zone (green zone): $76,723 - $77,342
- Strength: 627 (weaker than below)
- Analysis: There are some leveraged shorts above the current price. If the market rebounds, it could rise as high as the 76,700 - 77,300 area to liquidate these highly leveraged short positions. However, overall, there is strong resistance overhead (the green lines run through a dense cluster).