$UAI Massive Rebound! +61% Bounce! Is the Bottom Finally In? 🚀
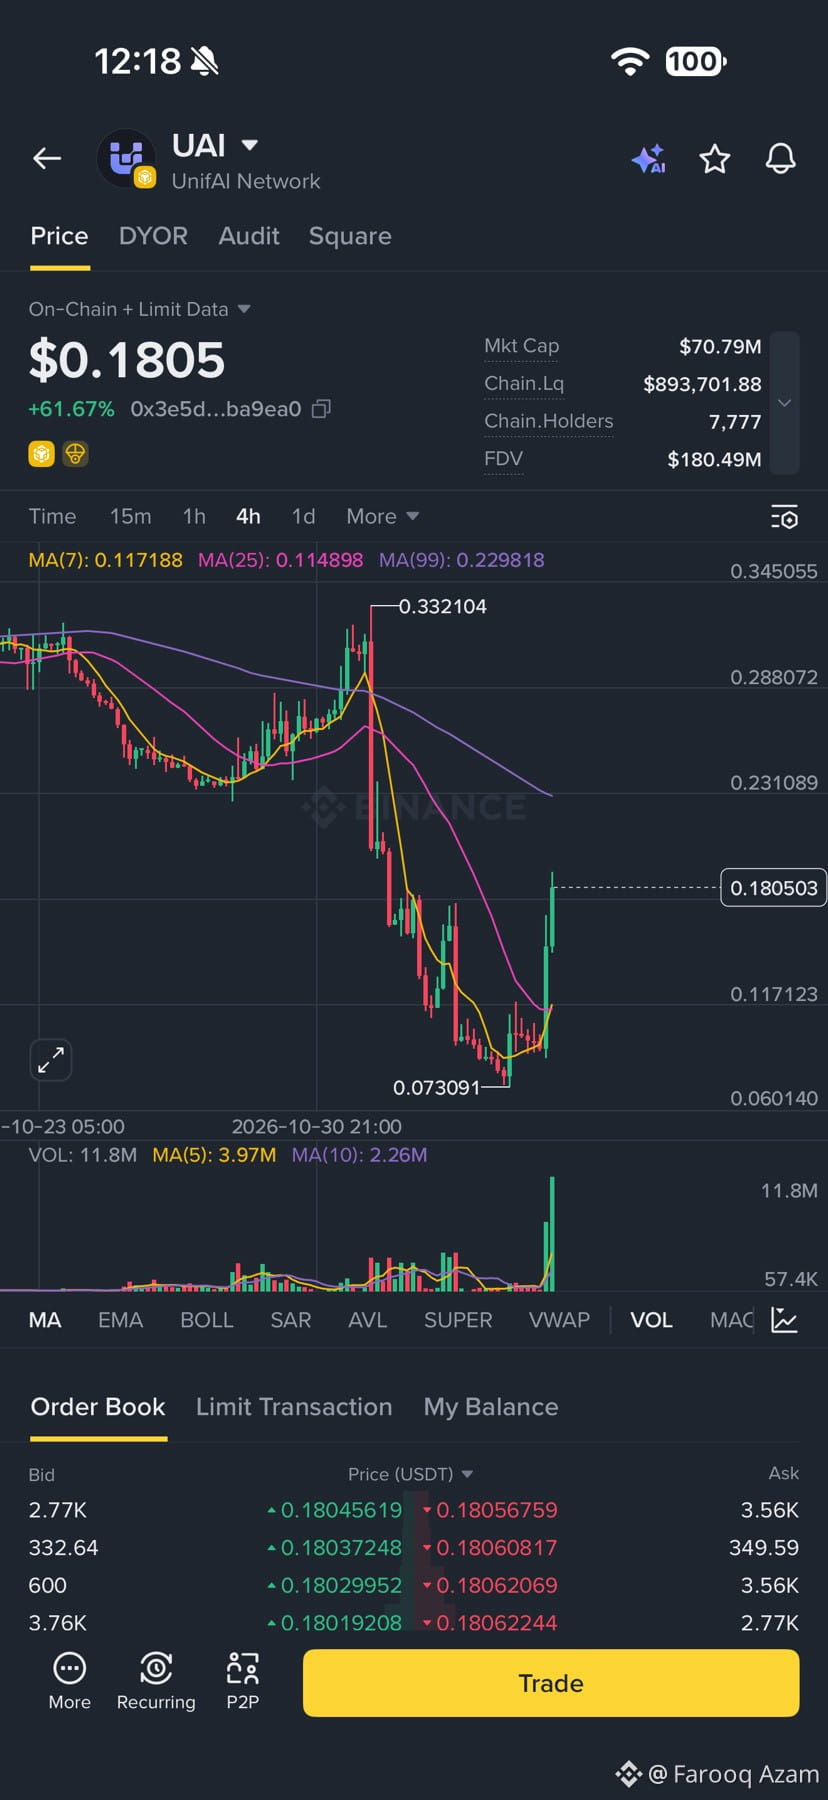
The $UAI chart is waking up! After a brutal downtrend, the bulls have stepped in with a massive daily green candle. Let’s break down the technicals and what to watch next.
Current Market Data:
- Price: $0.1805
- 24H Change: +61.67%
- Market Cap: $70.79M
- Chain Liquidity: $893.7K
- Holders: 7,777
- FDV: $180.49M
Technical Analysis (4H Chart):
The V-Shaped Recovery: After a devastating drop from the local high of 0.073, 0.117) and the 25-period MA (0.229). Until the price reclaims this level, the macro trend is still technically down.
Volume Explosion: Look at that bottom indicator! The volume spike on this recent bounce is huge compared to the preceding days. Buyers are definitely stepping in.
⚠️ Key Risks to Keep in Mind:
- FDV vs. Market Cap: Market cap is ~180M. This means there are a lot of locked tokens that will eventually enter circulation, creating future sell pressure.
- Liquidity is Thin: With under $1M in liquidity, this token is highly susceptible to extreme volatility and slippage. A large whale buy or sell can easily move the chart.
- Holder Count: With only 7,777 holders, the token is still in its early distribution phase.
My Verdict:
This is a textbook relief rally/meme bounce. The volume is there and short-term momentum is definitely bullish. However, because it is still trading below the MA(99), this could just be a lower high before another leg down.
If you are trading this, play it tight. Watch for a retest of the MA(7) around $0.117. If it holds as support, we might see a push toward $0.23. If it loses that level, get out of the way.
Always use a tight stop loss on high-volatility plays like this!
Are you catching this $UAI bounce or waiting for confirmation? Let’s discuss below! 👇
Disclaimer: This is not financial advice. Always do your own research (DYOR).
#UAI #UnifAI #BinanceSquare #TechnicalAnalysis #DYOR
The $UAI chart is waking up! After a brutal downtrend, the bulls have stepped in with a massive daily green candle. Let’s break down the technicals and what to watch next.
Current Market Data:
- Price: $0.1805
- 24H Change: +61.67%
- Market Cap: $70.79M
- Chain Liquidity: $893.7K
- Holders: 7,777
- FDV: $180.49M
Technical Analysis (4H Chart):
The V-Shaped Recovery: After a devastating drop from the local high of 0.073, 0.117) and the 25-period MA (0.229). Until the price reclaims this level, the macro trend is still technically down.
Volume Explosion: Look at that bottom indicator! The volume spike on this recent bounce is huge compared to the preceding days. Buyers are definitely stepping in.
⚠️ Key Risks to Keep in Mind:
- FDV vs. Market Cap: Market cap is ~180M. This means there are a lot of locked tokens that will eventually enter circulation, creating future sell pressure.
- Liquidity is Thin: With under $1M in liquidity, this token is highly susceptible to extreme volatility and slippage. A large whale buy or sell can easily move the chart.
- Holder Count: With only 7,777 holders, the token is still in its early distribution phase.
My Verdict:
This is a textbook relief rally/meme bounce. The volume is there and short-term momentum is definitely bullish. However, because it is still trading below the MA(99), this could just be a lower high before another leg down.
If you are trading this, play it tight. Watch for a retest of the MA(7) around $0.117. If it holds as support, we might see a push toward $0.23. If it loses that level, get out of the way.
Always use a tight stop loss on high-volatility plays like this!
Are you catching this $UAI bounce or waiting for confirmation? Let’s discuss below! 👇
Disclaimer: This is not financial advice. Always do your own research (DYOR).
#UAI #UnifAI #BinanceSquare #TechnicalAnalysis #DYOR