This ZEC chart is practically a mass grave for short sellers!
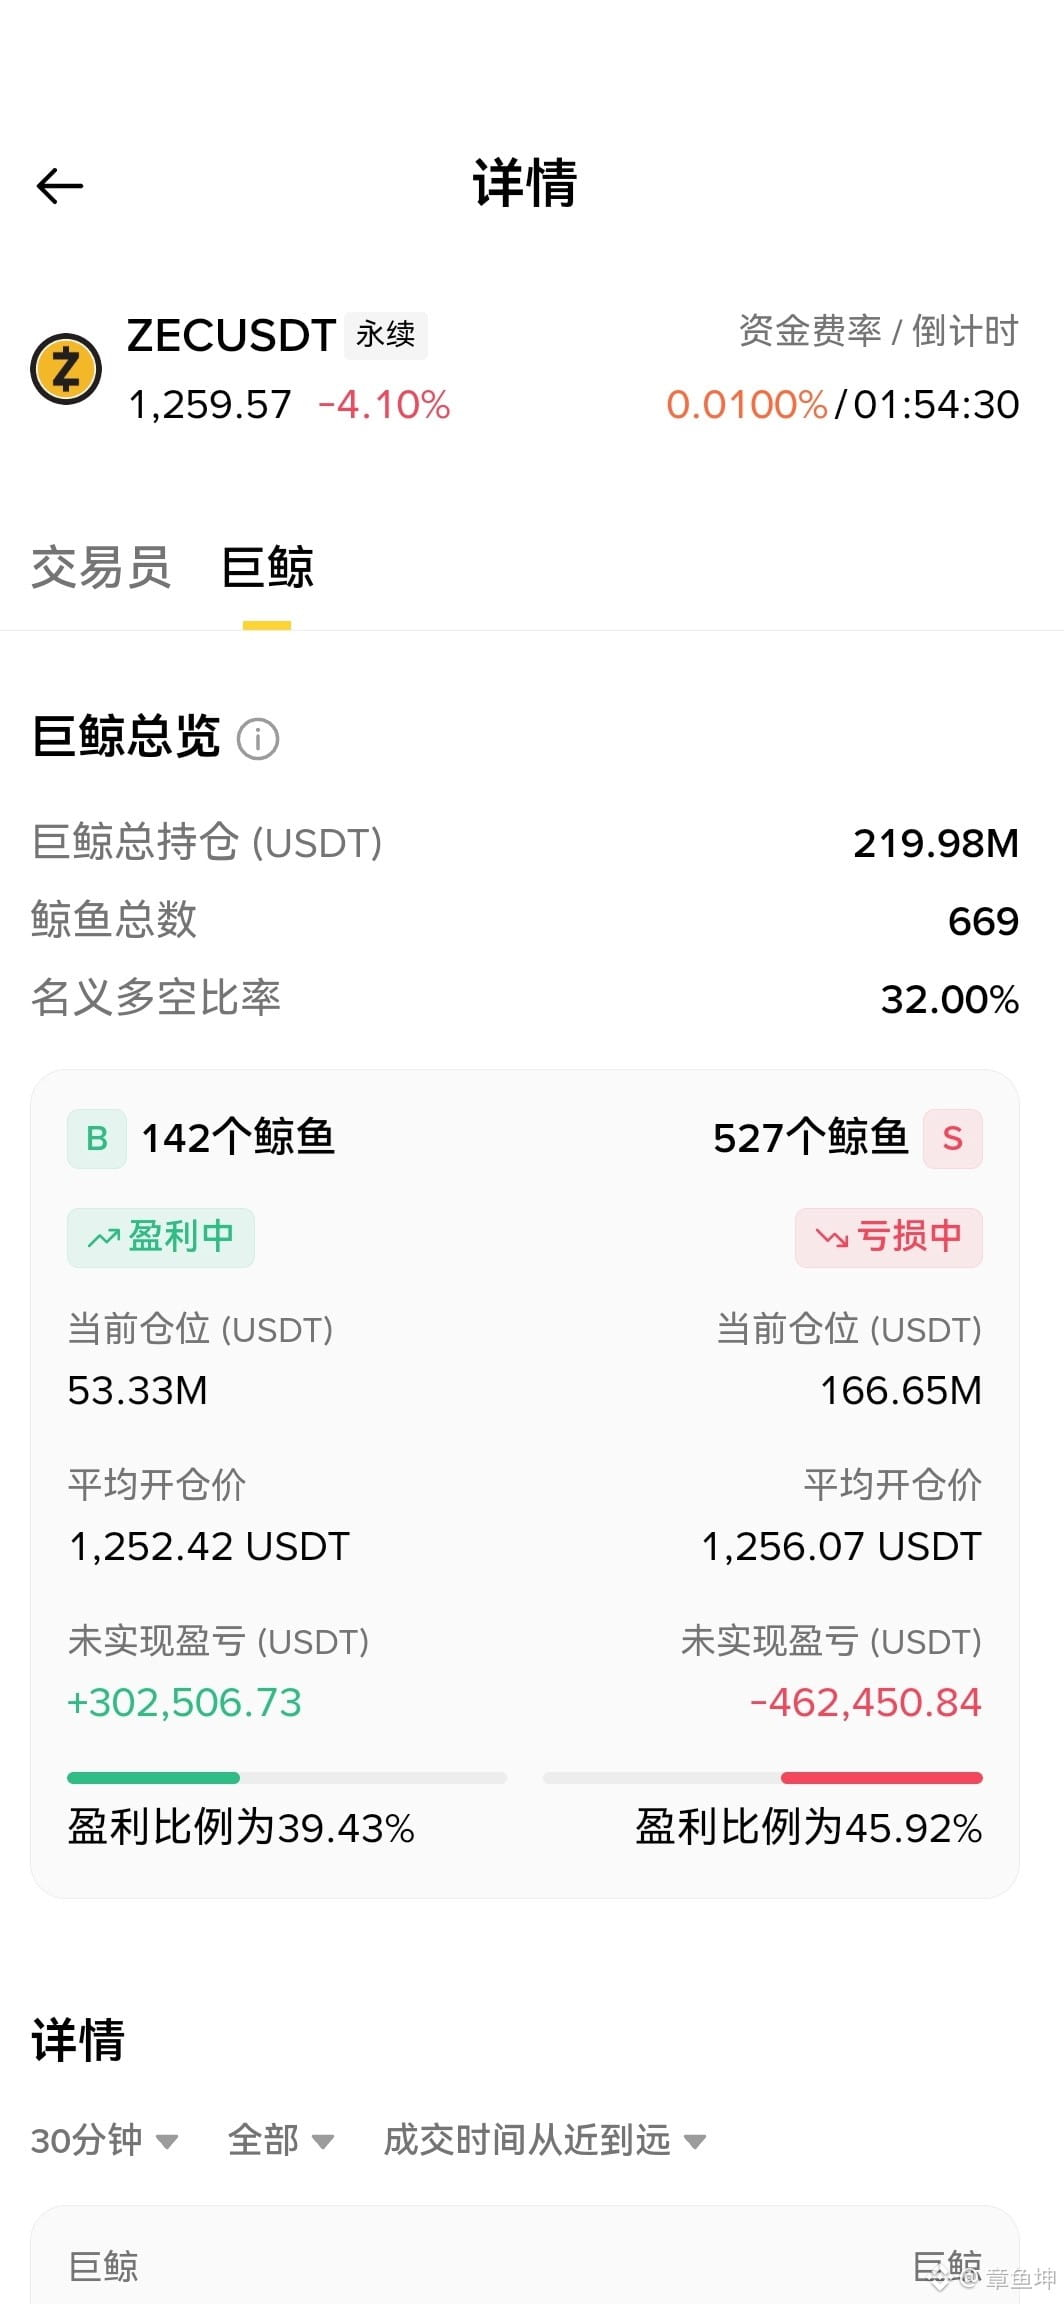
Look at the numbers: 870 shorts versus just 403 longs! The shorts have more people and more money, but what happened? Their average entry is 1255 and they're all underwater, down 470K U, while the longs are steadily taking profits.
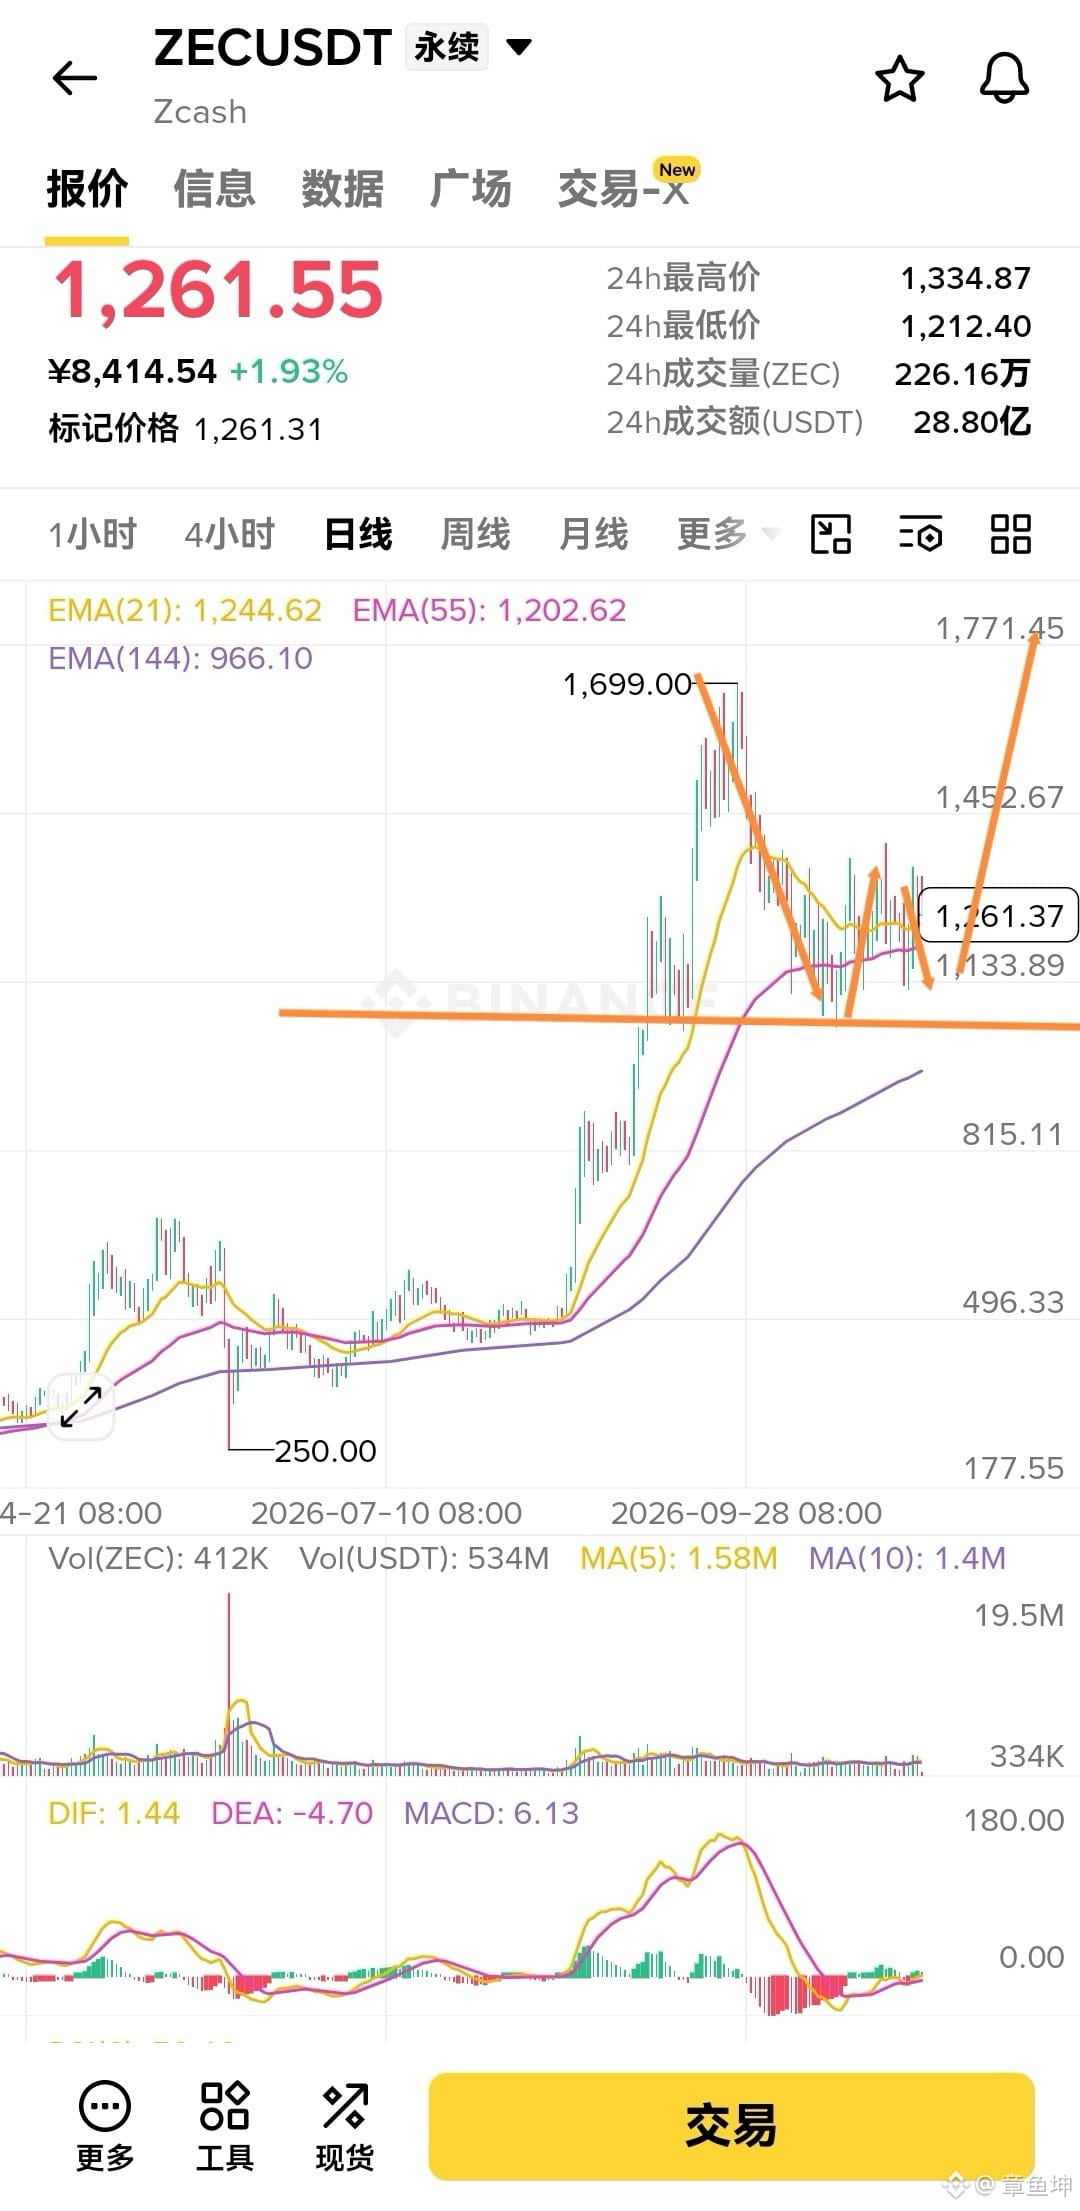
Now look at the candlesticks: the daily chart is holding firmly on EMA21 (1244), its lifeline, while all the moving averages on the 4-hour chart have converged. What does that mean? A major move is imminent, and support below is extremely strong! The market manipulators could pump the price at any moment and wipe out all 870 shorts!
My strategy is crystal clear: lean on support and go long with confidence!
Get in directly in the 1245 - 1255 range, with a stop below the daily EMA55 at 1230. First target: the previous high of 1350; if it breaks through on strong volume, look straight to 1400!$ZEC
Look at the numbers: 870 shorts versus just 403 longs! The shorts have more people and more money, but what happened? Their average entry is 1255 and they're all underwater, down 470K U, while the longs are steadily taking profits.
Now look at the candlesticks: the daily chart is holding firmly on EMA21 (1244), its lifeline, while all the moving averages on the 4-hour chart have converged. What does that mean? A major move is imminent, and support below is extremely strong! The market manipulators could pump the price at any moment and wipe out all 870 shorts!
My strategy is crystal clear: lean on support and go long with confidence!
Get in directly in the 1245 - 1255 range, with a stop below the daily EMA55 at 1230. First target: the previous high of 1350; if it breaks through on strong volume, look straight to 1400!$ZEC