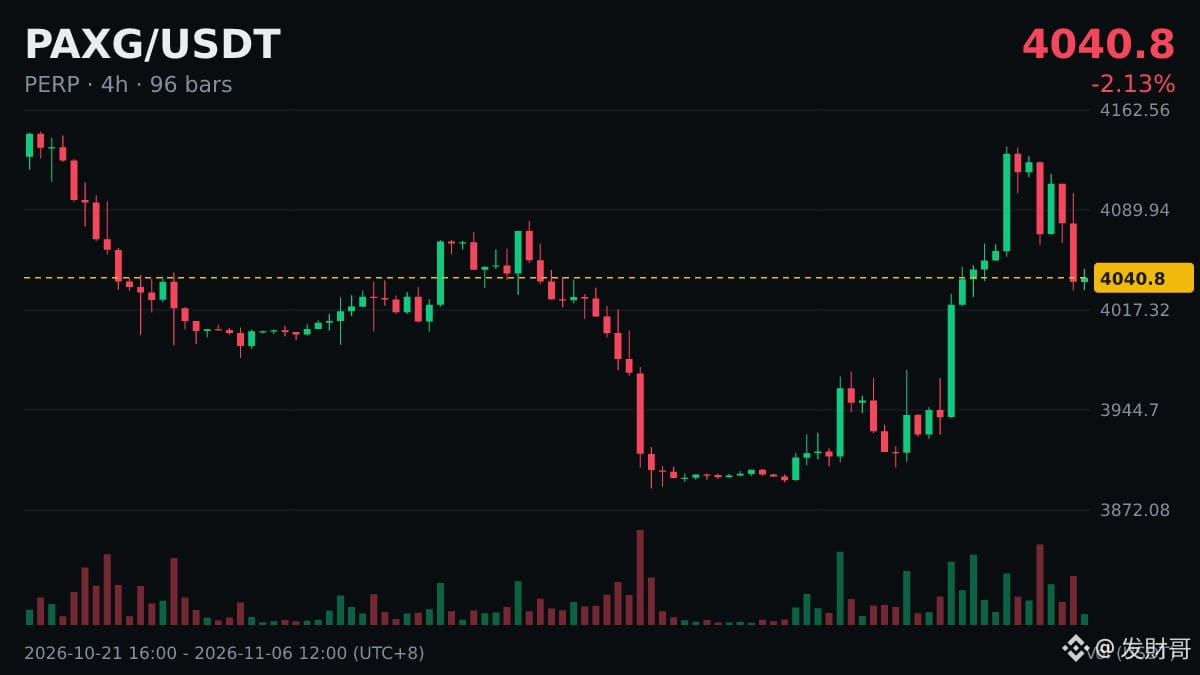
In plain English: On the $PAXG 4-hour chart, the MACD made a death cross above the zero line, after 27 consecutive histogram bars pointing the other way.
When the fast and slow lines meet, my fingers start itching to do something—but luckily, I checked what it was first.
A quick explanation: The zero line is where DIF = 0, meaning the 12-period EMA and 26-period EMA overlap. When DIF is above the zero line, the short-term moving average is above the longer-term one.
With a leveraged position, first work out whether you can withstand the worst-case scenario, then consider what the signal is telling you.
#PAXG
When the fast and slow lines meet, my fingers start itching to do something—but luckily, I checked what it was first.
A quick explanation: The zero line is where DIF = 0, meaning the 12-period EMA and 26-period EMA overlap. When DIF is above the zero line, the short-term moving average is above the longer-term one.
With a leveraged position, first work out whether you can withstand the worst-case scenario, then consider what the signal is telling you.
#PAXG