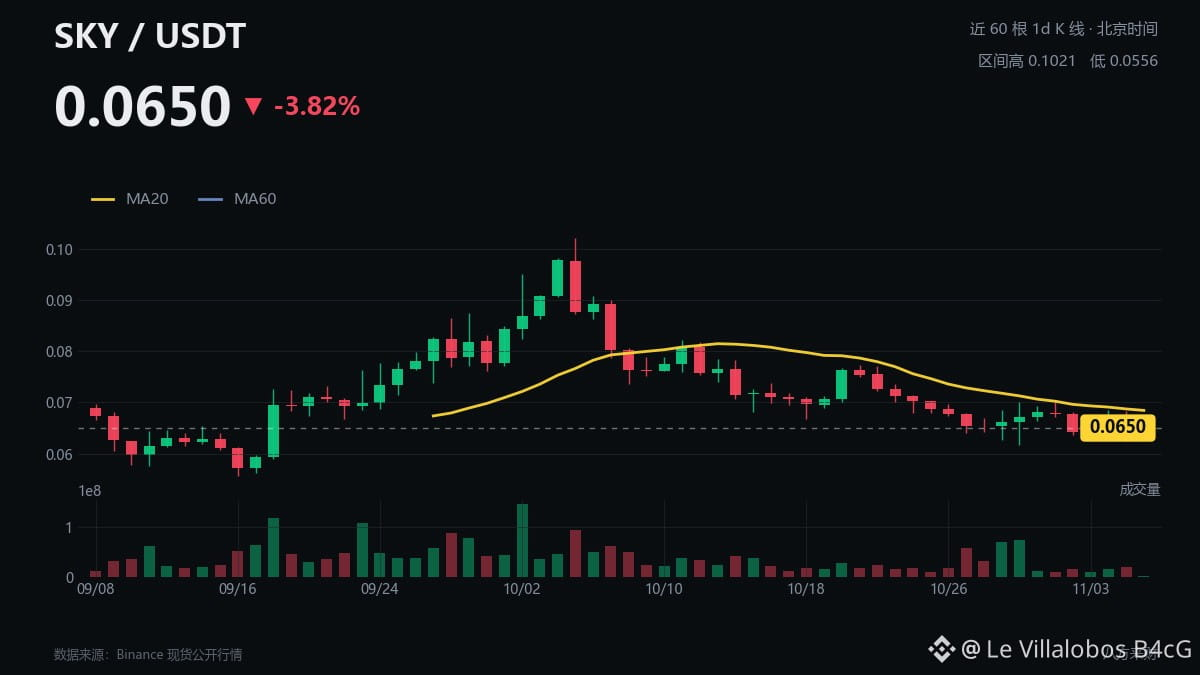
$SKY Current price is 0.0650, at the 21st percentile of the 20-day range. Daily RSI is 34 and 4H RSI is 48—the price is hugging just 0.33% below the 4H EMA9 (0.0652), yet remains 5.03% below MA20. In a weak market, where price sits may matter more than the size of the drop itself.
📍 Key levels: 0.0667 is the weekly MA50, with the current price 2.56% below it; this is a key reference point for the medium-term structure. The 4H EMA9 at 0.0652 is almost exactly in line with the current price, where bulls and bears are battling in the short term. Below, 0.0617 is the lower bound of the 20-day range and the floor of the current range.
⚠️ Risk levels: A sustained reclaim of 0.0667 would provide a basis for discussing whether the weekly structure is shifting from resistance to support. A break below the 0.0617 range low would invalidate the 20-day range pattern. The current volume ratio is 0.80× and 24h trading volume is 0.00B; with volume contracting, any breakout in either direction lacks volume confirmation.
💰 Positioning: The large-trader long/short ratio is 1.41, indicating a bullish bias, while the overall long/short ratio is 0.71, indicating a bearish bias—the two are diverging. Daily RSI at 34 is nearing oversold territory. Large traders are positioned long while retail traders are positioned short; this divergence is itself a structural signal, not a directional conclusion.
Which do you consider more important: a reclaim of the 0.0667 weekly MA50, or the divergence between the large-trader and overall long/short ratios?
📍 Key levels: 0.0667 is the weekly MA50, with the current price 2.56% below it; this is a key reference point for the medium-term structure. The 4H EMA9 at 0.0652 is almost exactly in line with the current price, where bulls and bears are battling in the short term. Below, 0.0617 is the lower bound of the 20-day range and the floor of the current range.
⚠️ Risk levels: A sustained reclaim of 0.0667 would provide a basis for discussing whether the weekly structure is shifting from resistance to support. A break below the 0.0617 range low would invalidate the 20-day range pattern. The current volume ratio is 0.80× and 24h trading volume is 0.00B; with volume contracting, any breakout in either direction lacks volume confirmation.
💰 Positioning: The large-trader long/short ratio is 1.41, indicating a bullish bias, while the overall long/short ratio is 0.71, indicating a bearish bias—the two are diverging. Daily RSI at 34 is nearing oversold territory. Large traders are positioned long while retail traders are positioned short; this divergence is itself a structural signal, not a directional conclusion.
Which do you consider more important: a reclaim of the 0.0667 weekly MA50, or the divergence between the large-trader and overall long/short ratios?