$ETH A casual chart chat: This needle feels a little too familiar
Alright, let’s look at Ethereum.
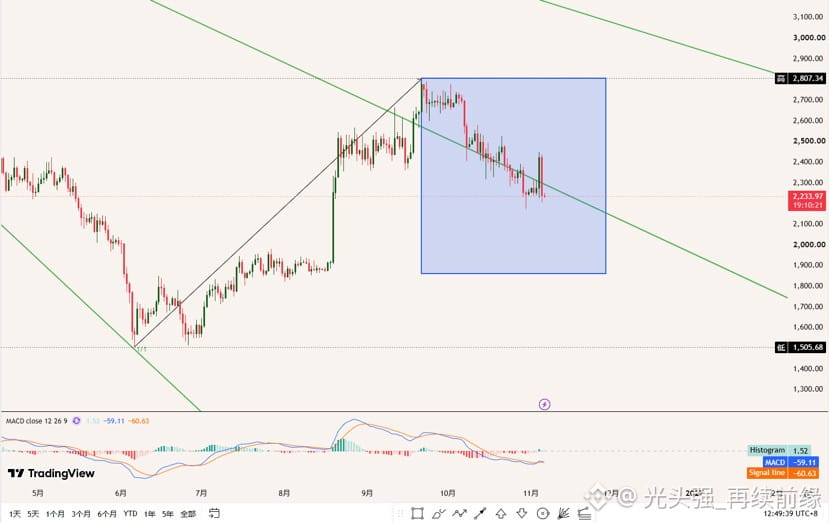
First, let’s zoom out. This rally climbed all the way from the 1,505 low to a peak of 2,807. Pretty satisfying, right? But look at the blue box in Chart 1—the price has now fallen back to 2,233, and the green descending trendline is pressing down on it. Put simply, the gains from that earlier rally are being given back bit by bit, and the sell-off isn’t over yet.
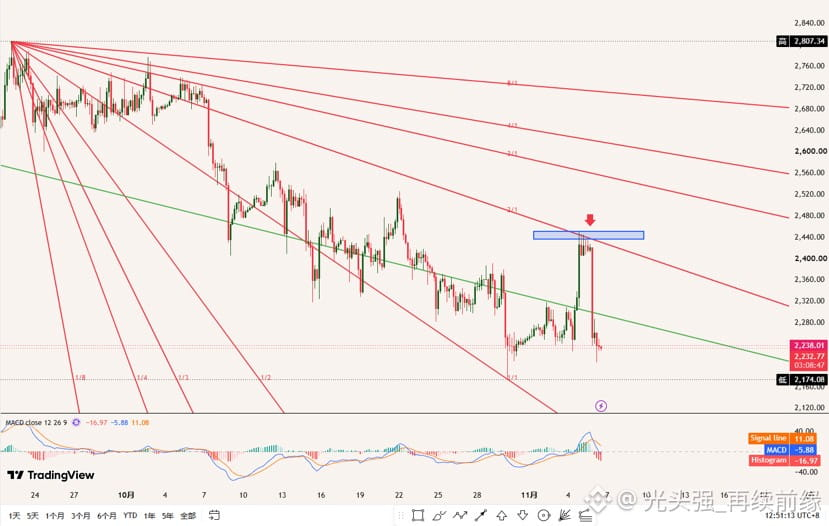
Now let’s zoom in on Chart 2—there’s more drama here. A few days ago, one big bullish candle shot straight up to 2,807. And what happened the next day? A long bearish candle slammed it back down—the classic “rally hard, then dump on everyone.” The blue zone around 2,440 has now turned into a ceiling. The red Gann lines below are stacked one on top of another, with the 2/1 and 3/1 lines both sloping down. The bears have their runway all laid out.
Let me put the indicators simply: on Chart 1, the higher-timeframe MACD is still hovering around the zero line. It’s barely hanging on, but it can’t get moving higher. On Chart 2, the lower-timeframe MACD has already crossed bearishly, and the histogram is at -16.97, showing bearish momentum. In the short term, it’s still falling—don’t try to catch it.
So what’s my take?
My preferred move is actually to wait for a bounce. If it rebounds into the 2,380–2,440 area, that’s right where the Gann resistance meets the ceiling that just gave way. Put the stop above 2,480, look for 2,230 first on the way down, and if that breaks, then 2,170. In a descending channel like this, shorting the bounce is much more comfortable than trying to pick a bottom.
Really itching to go long? Fine—try a small position near the previous low around 2,170–2,200, but be sure to put your stop below 2,140. Don’t get greedy with the target; take profit around 2,300–2,380.
Just remember these two key levels:
A daily close below 2,140 breaks the structure; next stop is the 2,000 round-number level.
A high-volume move above 2,480 would mean the bears can take a break for now—and only then would 2,600 be worth discussing.
At 2,233, it’s stuck in the most awkward spot—in limbo. I’d rather have a cup of coffee and wait for it to choose a direction.
Manage your position size, remember to use a stop on futures, and don’t let one needle teach you a lesson 🙏
(Just reading the charts and telling a story; this is not investment advice.)#ETH走势分析
Alright, let’s look at Ethereum.
First, let’s zoom out. This rally climbed all the way from the 1,505 low to a peak of 2,807. Pretty satisfying, right? But look at the blue box in Chart 1—the price has now fallen back to 2,233, and the green descending trendline is pressing down on it. Put simply, the gains from that earlier rally are being given back bit by bit, and the sell-off isn’t over yet.
Now let’s zoom in on Chart 2—there’s more drama here. A few days ago, one big bullish candle shot straight up to 2,807. And what happened the next day? A long bearish candle slammed it back down—the classic “rally hard, then dump on everyone.” The blue zone around 2,440 has now turned into a ceiling. The red Gann lines below are stacked one on top of another, with the 2/1 and 3/1 lines both sloping down. The bears have their runway all laid out.
Let me put the indicators simply: on Chart 1, the higher-timeframe MACD is still hovering around the zero line. It’s barely hanging on, but it can’t get moving higher. On Chart 2, the lower-timeframe MACD has already crossed bearishly, and the histogram is at -16.97, showing bearish momentum. In the short term, it’s still falling—don’t try to catch it.
So what’s my take?
My preferred move is actually to wait for a bounce. If it rebounds into the 2,380–2,440 area, that’s right where the Gann resistance meets the ceiling that just gave way. Put the stop above 2,480, look for 2,230 first on the way down, and if that breaks, then 2,170. In a descending channel like this, shorting the bounce is much more comfortable than trying to pick a bottom.
Really itching to go long? Fine—try a small position near the previous low around 2,170–2,200, but be sure to put your stop below 2,140. Don’t get greedy with the target; take profit around 2,300–2,380.
Just remember these two key levels:
A daily close below 2,140 breaks the structure; next stop is the 2,000 round-number level.
A high-volume move above 2,480 would mean the bears can take a break for now—and only then would 2,600 be worth discussing.
At 2,233, it’s stuck in the most awkward spot—in limbo. I’d rather have a cup of coffee and wait for it to choose a direction.
Manage your position size, remember to use a stop on futures, and don’t let one needle teach you a lesson 🙏
(Just reading the charts and telling a story; this is not investment advice.)#ETH走势分析