Only 1 of 32 highly liquid assets is up—how far has the $INJ ETF catalyst traveled?
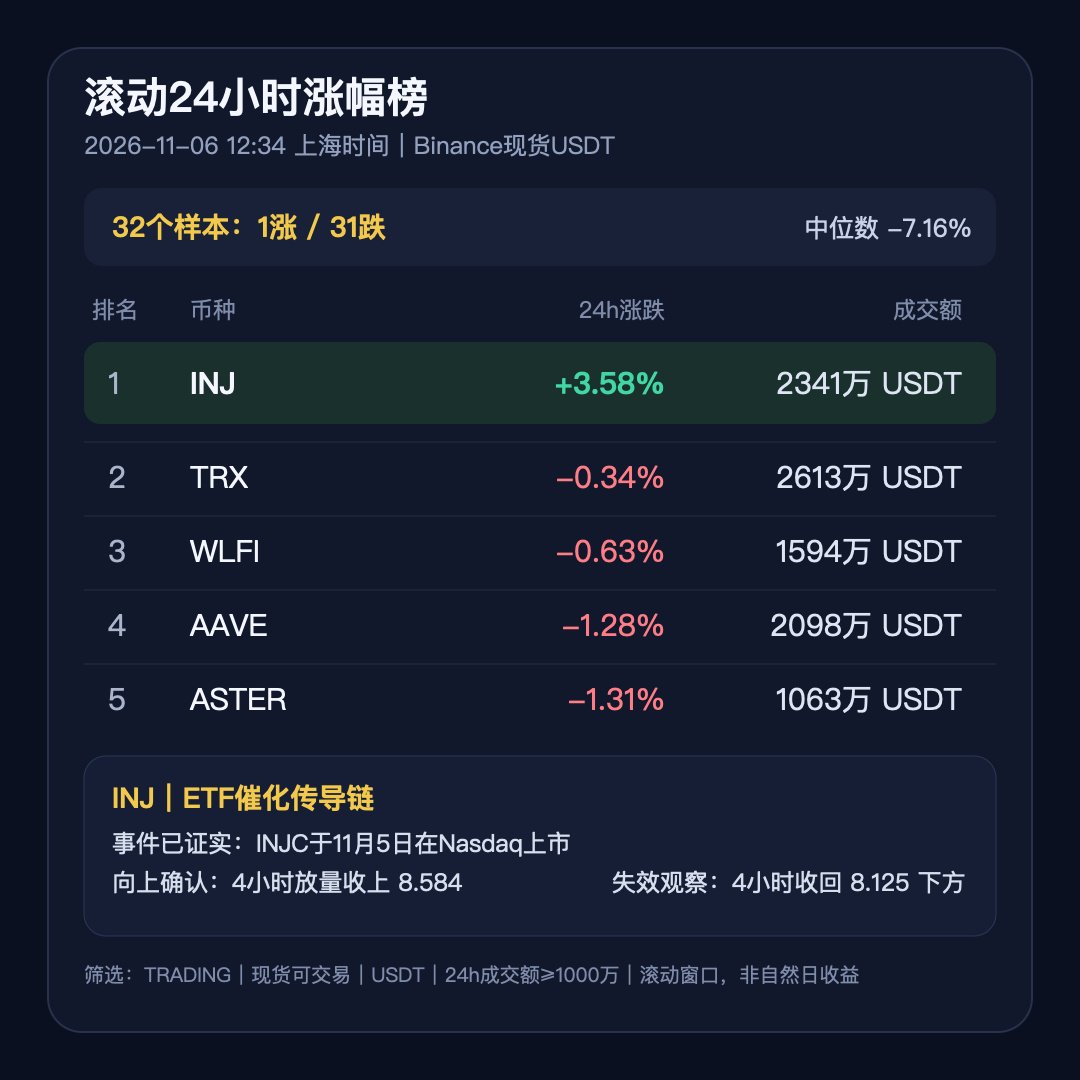
On Binance’s rolling 24-hour spot leaderboard at 12:34 Shanghai time, INJ is up 3.58%, with trading volume of approximately 23.41 million USDT. The next four assets—TRX, WLFI, AAVE, and ASTER—are all still in the red. Of 32 qualifying assets, only 1 is up and 31 are down, with a median return of -7.16%. This means INJ’s relative strength is real, but it is also running against extremely weak market breadth. Being “at the top of the leaderboard” does not, by itself, confirm a trend.
Why now? On November 5, Injective officially confirmed that the Canary Staked INJ ETF (INJC) had listed on Nasdaq. The product aims to provide exposure to the price of INJ, with net staking rewards reflected in the fund’s net asset value. This catalyst is confirmed, but the official page does not provide first-day trading volume, assets under management, or net inflows. So the key link in the chain—that “the ETF has brought sustained spot buying”—remains unconfirmed.
The price action offers evidence in both directions. INJ’s most recent completed 4-hour candle closed at 8.388, up from 8.147, on trading volume of approximately 2.36 million USDT—about 1.14 times the average of roughly 2.08 million over the previous 24 four-hour periods. This suggests the recovery was not entirely unsupported by volume. On the other hand, the most recent completed hourly candle had trading volume of only about 477,000 USDT, just 0.49 times the 24-hour average of roughly 968,000. And after the previous rally to 8.584, the following 4-hour period saw volume spike to about 7.24 million USDT, with a low of 7.778. The catalyst is there, but that does not mean overhead selling pressure has disappeared.
Next, let’s break the transmission chain into three verifiable scenarios:
Effective continuation: Completed 4-hour trading volume is at least the recent average of roughly 2.08 million USDT, and the candle closes above 8.584. A subsequent retest that holds near 8.32 would then suggest the market’s response is beginning to translate into price confirmation.
Range-bound digestion: Price stays between 8.125 and 8.584, while hourly trading volume remains below the average of roughly 968,000 USDT. This looks more like post-event turnover: it confirms neither a breakout nor an early shift to weakness.
A second failure: If a completed 1-hour candle closes below 8.125 on increased volume, followed by a break below 7.778, that would suggest INJ’s relative strength is being overwhelmed by broader market selling. A 4-hour close back below 8.125 would invalidate the current thesis that the catalyst is continuing to feed through into price.
The main risks are the absence of first-day ETF flow data, repeated pricing-in of a single event, and market beta suddenly overpowering individual-asset strength while 31 assets are falling. Open $INJ and first check real-time 4-hour trading volume, whether a completed candle can hold above 8.584, and whether 8.125 remains support. Then decide whether the ETF transmission chain has reached price confirmation—or is still only at the narrative and relative-strength stage.
On Binance’s rolling 24-hour spot leaderboard at 12:34 Shanghai time, INJ is up 3.58%, with trading volume of approximately 23.41 million USDT. The next four assets—TRX, WLFI, AAVE, and ASTER—are all still in the red. Of 32 qualifying assets, only 1 is up and 31 are down, with a median return of -7.16%. This means INJ’s relative strength is real, but it is also running against extremely weak market breadth. Being “at the top of the leaderboard” does not, by itself, confirm a trend.
Why now? On November 5, Injective officially confirmed that the Canary Staked INJ ETF (INJC) had listed on Nasdaq. The product aims to provide exposure to the price of INJ, with net staking rewards reflected in the fund’s net asset value. This catalyst is confirmed, but the official page does not provide first-day trading volume, assets under management, or net inflows. So the key link in the chain—that “the ETF has brought sustained spot buying”—remains unconfirmed.
The price action offers evidence in both directions. INJ’s most recent completed 4-hour candle closed at 8.388, up from 8.147, on trading volume of approximately 2.36 million USDT—about 1.14 times the average of roughly 2.08 million over the previous 24 four-hour periods. This suggests the recovery was not entirely unsupported by volume. On the other hand, the most recent completed hourly candle had trading volume of only about 477,000 USDT, just 0.49 times the 24-hour average of roughly 968,000. And after the previous rally to 8.584, the following 4-hour period saw volume spike to about 7.24 million USDT, with a low of 7.778. The catalyst is there, but that does not mean overhead selling pressure has disappeared.
Next, let’s break the transmission chain into three verifiable scenarios:
Effective continuation: Completed 4-hour trading volume is at least the recent average of roughly 2.08 million USDT, and the candle closes above 8.584. A subsequent retest that holds near 8.32 would then suggest the market’s response is beginning to translate into price confirmation.
Range-bound digestion: Price stays between 8.125 and 8.584, while hourly trading volume remains below the average of roughly 968,000 USDT. This looks more like post-event turnover: it confirms neither a breakout nor an early shift to weakness.
A second failure: If a completed 1-hour candle closes below 8.125 on increased volume, followed by a break below 7.778, that would suggest INJ’s relative strength is being overwhelmed by broader market selling. A 4-hour close back below 8.125 would invalidate the current thesis that the catalyst is continuing to feed through into price.
The main risks are the absence of first-day ETF flow data, repeated pricing-in of a single event, and market beta suddenly overpowering individual-asset strength while 31 assets are falling. Open $INJ and first check real-time 4-hour trading volume, whether a completed candle can hold above 8.584, and whether 8.125 remains support. Then decide whether the ETF transmission chain has reached price confirmation—or is still only at the narrative and relative-strength stage.