$BTC: When a Down Move Is Missed: The Anchoring Trap
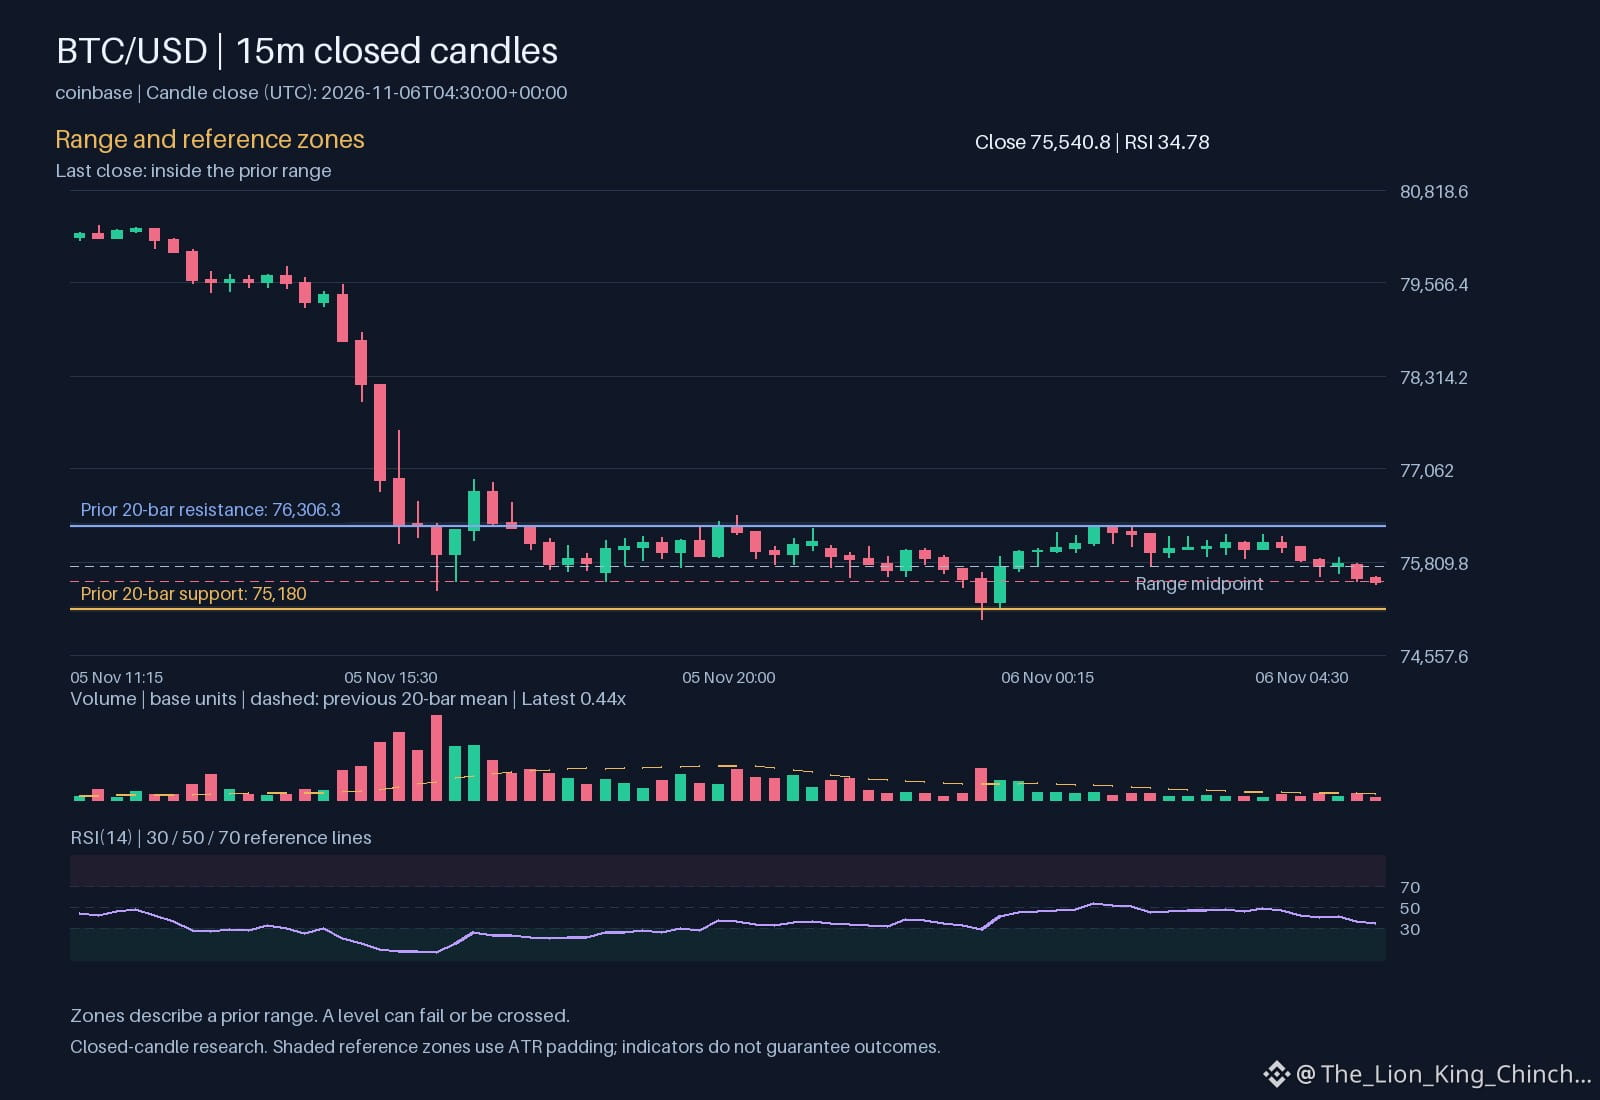
The recent hourly chart for $BTC shows a down direction while volume sits below the baseline. This pattern often feels like a clear signal, but it also creates a classic anchoring bias. Anchoring occurs when traders fixate on the most recent price action and let that initial impression shape later decisions, even if new data contradicts it.
When a trader watches a sharp drop and expects the price to keep falling, they may cling to that expectation. If the market later stabilises or reverses, the anchored view can cause hesitation to act, or an over‑reaction to re‑enter at a worse price. The bias changes a research decision by making the analyst overweight the most recent direction and underweight other indicators such as the relative volume 0.438265 or the longer‑term EMA levels.
A practical self‑check: pause after spotting the down move and ask, “What would I conclude if the next hour showed a neutral direction and volume remained low?” Write down the alternative view, then compare it with the original anchored impression. This simple note‑taking step helps break the fixation and encourages a more balanced assessment before committing to a trade.
Remember, the market can surprise you; the goal is to keep your analysis flexible, not locked to the first signal you see.
Probabilistic market research, not a recommendation or guaranteed return.
Would you keep the same rule after missing a move?
#BTC #TradingPsychology #CryptoLearning
The recent hourly chart for $BTC shows a down direction while volume sits below the baseline. This pattern often feels like a clear signal, but it also creates a classic anchoring bias. Anchoring occurs when traders fixate on the most recent price action and let that initial impression shape later decisions, even if new data contradicts it.
When a trader watches a sharp drop and expects the price to keep falling, they may cling to that expectation. If the market later stabilises or reverses, the anchored view can cause hesitation to act, or an over‑reaction to re‑enter at a worse price. The bias changes a research decision by making the analyst overweight the most recent direction and underweight other indicators such as the relative volume 0.438265 or the longer‑term EMA levels.
A practical self‑check: pause after spotting the down move and ask, “What would I conclude if the next hour showed a neutral direction and volume remained low?” Write down the alternative view, then compare it with the original anchored impression. This simple note‑taking step helps break the fixation and encourages a more balanced assessment before committing to a trade.
Remember, the market can surprise you; the goal is to keep your analysis flexible, not locked to the first signal you see.
Probabilistic market research, not a recommendation or guaranteed return.
Would you keep the same rule after missing a move?
#BTC #TradingPsychology #CryptoLearning