

Daily Updates
Yesterday’s analysis has basically been invalidated. I’m putting out an extra update a few days early.
Yesterday’s Bitcoin rebound—both its break above a key level and its chart structure—pointed to the possibility of a short-term rebound lasting one 4-hour-level move. But sometimes the actual market action can diverge from technical patterns. The sharp sell-off in overseas markets, including the U.S., Japan, and South Korea, also sent Bitcoin into an extreme Bart-pattern move.
In a typical market move, whether Bitcoin breaks above a key level or falls below one, the price action generally follows a fairly clear structure. But markets don’t always move so neatly, and unexpected structures often appear—for example, a segment breaking down or a single move forming an entire segment.
Since no one's technical analysis framework is万能的 and can account for every market move, should we still follow technical rules? I think we should. How do you make money—by constantly switching between bullish and bearish views and then second-guessing yourself? Or by guessing that the market might keep falling while worrying it could suddenly reverse? You need something to anchor your view so you can keep looking ahead.
As for those unusual market conditions that technical analysis can't account for, I think they can only be addressed through position management and risk controls.
Medium- to short-term trend direction
Main direction on the 4h timeframe: The third 4h leg down within the daily downtrend has extended, and may not be over yet.
Direction on the 1h timeframe: The 1h downtrend is underway; let's see how strong the decline is.
BTC short-term outlook
Because the market can change quickly in the short term, this article can only offer a forecast based on conditions at the time of publication. Short-term traders should keep an eye on the latest market moves; this is for reference only.
1H:
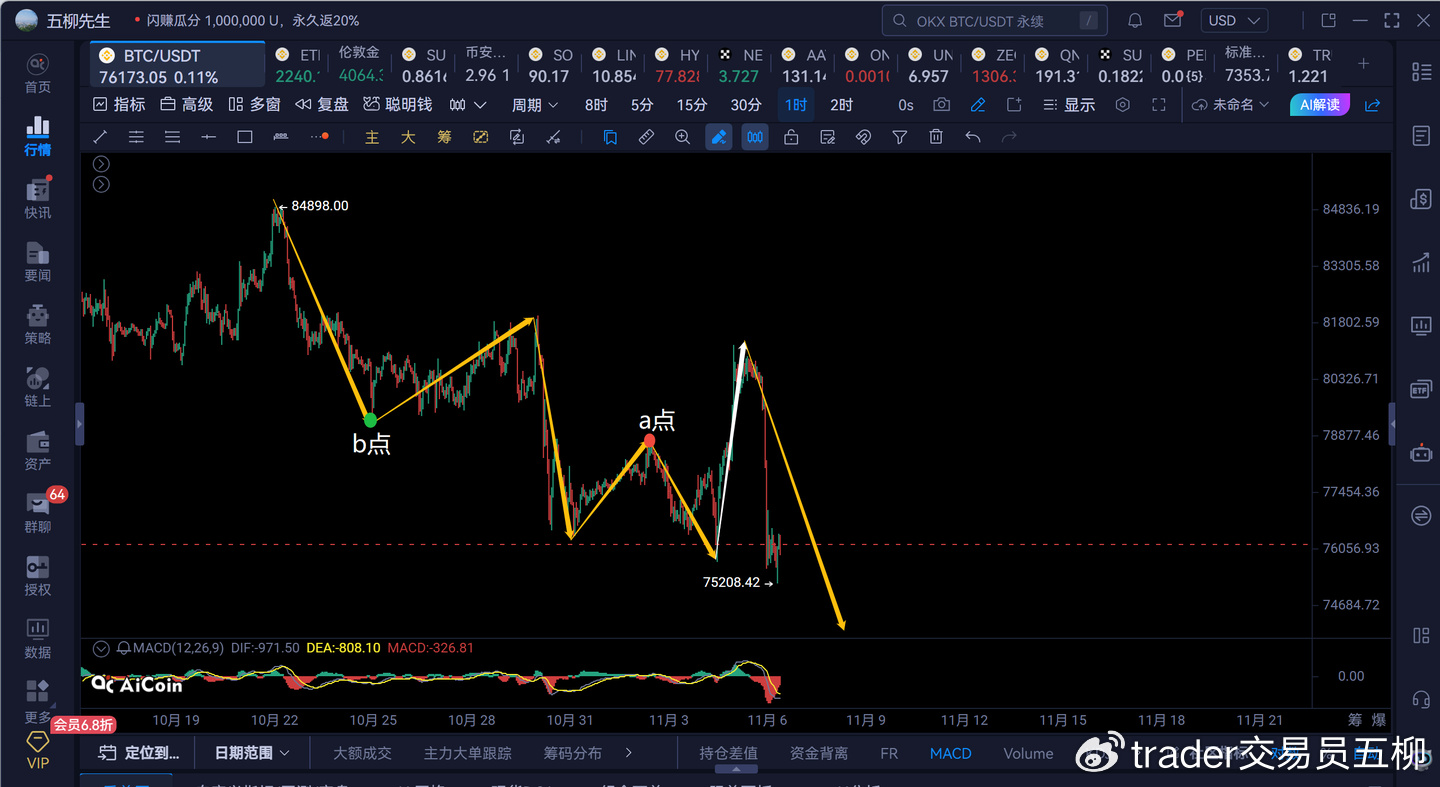
1) As shown above, point b (79220) and point a (78878) do not overlap, so they do not form a consolidation zone. The move from 84898 to 75736 can be simplified into the five legs shown above. After five legs, with divergence in place, the 4h decline could already have ended at 78878.
The rebound from 75736 to 81196 first broke above point a, then broke above point b at 79220. In terms of its structure, this rebound does have the potential to be a 4h rebound. If points b and a had overlapped to form a consolidation zone, we could still say yesterday's rebound was an extension of that zone. But they didn't form one, so yesterday's rebound actually disrupted the downtrend structure.
From a technical standpoint, our reasoning yesterday that a 4h rebound was beginning in the short term was sound. But market movements aren't always fully explained by technical analysis alone. Sometimes news, the liquidation of leveraged positions by major players, and other factors affect the market, so it's perfectly normal for price action to behave strangely and go against the logic we had before.
2) Yesterday price broke above a key level, but today it fell below the previous low. So the only conclusion here is that the 4h decline that began at 84898 has extended. Looking at the short-term structure, the decline is very likely not over yet, and price could continue lower to break below 75000.
3) The key support zone to watch is 74000–75000. If it doesn't hold, price could test around 72500 or 70600.
4) Over the past half month, the targets for the daily decline have consistently been 74500, 72500, and 70600. But yesterday's rebound really threw a wrench in the works and made me think the overall structure had changed.
15M:
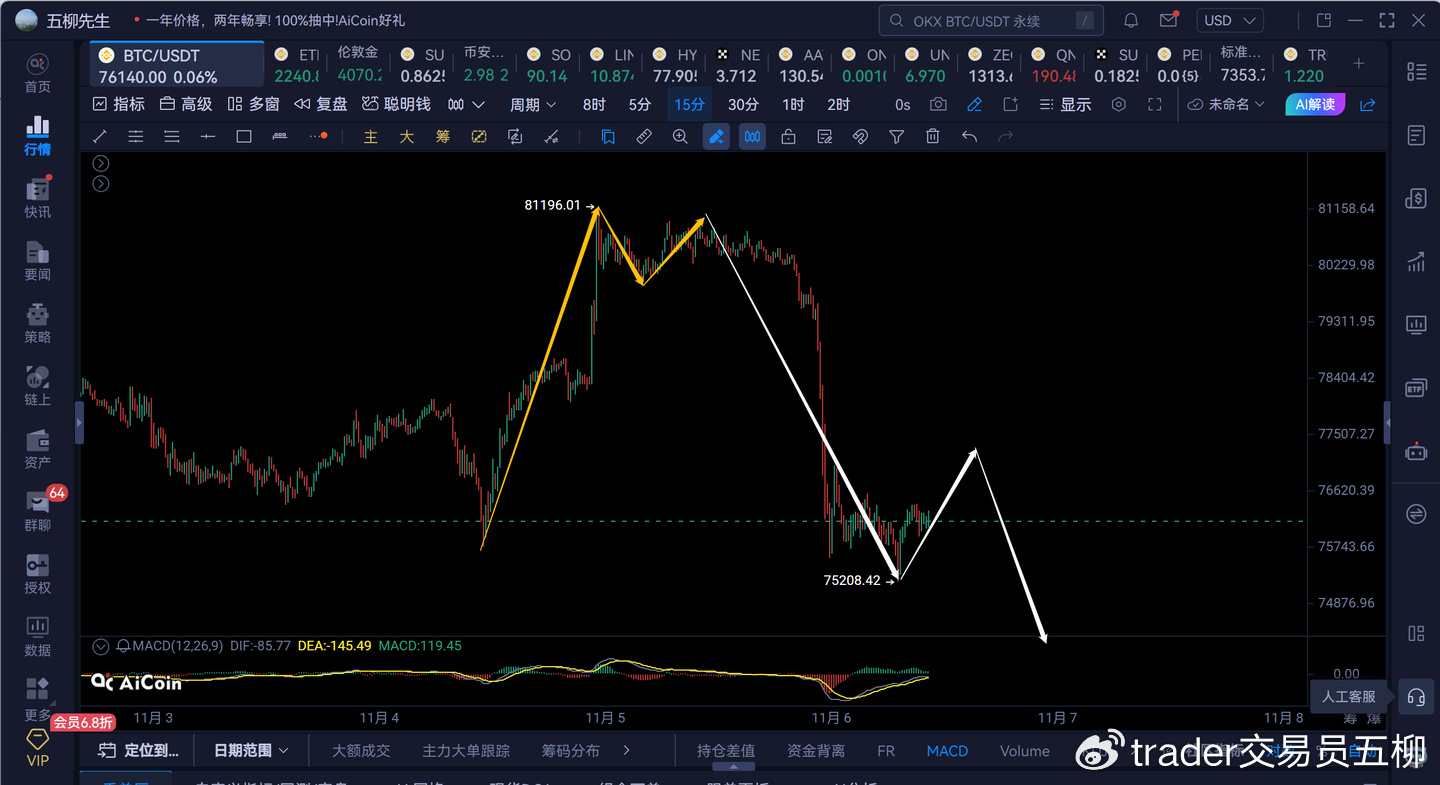
1) On the 15-minute timeframe, yesterday's rebound failed to break above 81196 again. Structurally, we can just about say it formed a 1h rebound.
2) The 15-minute decline has now plunged straight down to 75208. The current move should be the second leg of a 15-minute rebound.
3) As long as the rebound can't get past 78800, there should be another 15-minute leg down. Let's see how strong that next decline is.
4) If 74000 doesn't hold, BTC could wick down to around 70000. Personally, though, I still think this decline is the final shakeout in the daily correction, and that the outlook for the next few months is more likely to be bullish.
ETH
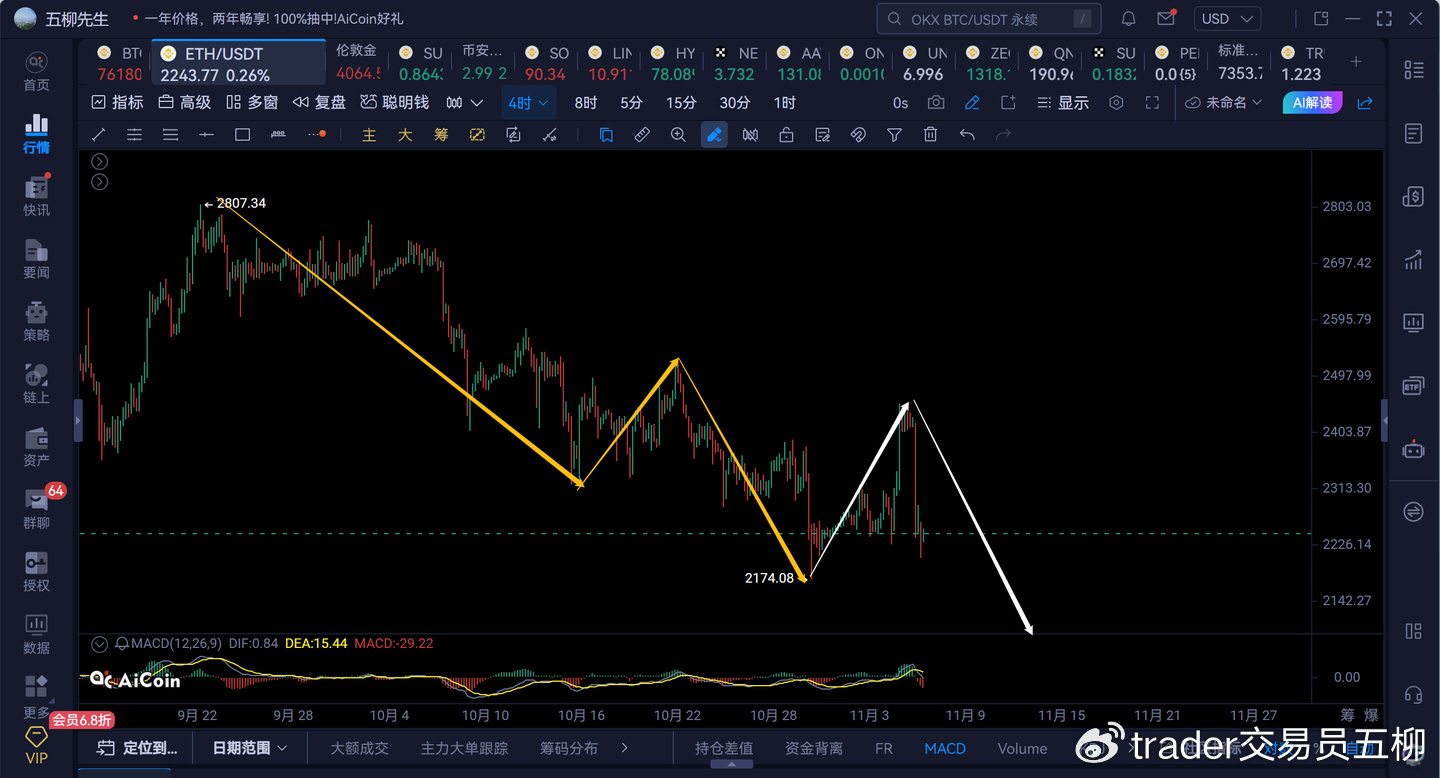
1) It's not yet clear whether the 4h rebound in ETH that started at 2174 is over. The key level to watch is whether the current pullback breaks below 2174. If it does, then the move from around 2450 is very likely the fifth 4h leg down within a daily downtrend.
2) If ETH makes a fifth 4h leg down in the short term, it will need to trend down in a choppy way for at least another five or six days. If so, it should reach around 2030. For now, it's hard to say whether it will briefly dip below 2000.
3) Of course, if the 1h downtrend structure completes without breaking below 2174, then the short-term move could still be part of a 4h rebound, but that currently seems less likely.
4) During the day, watch for a 15-minute rebound. If it can't get past 2400, there should be another 15-minute leg down.