

Liquidity sweep or free fall? 📉🔥
Today's trading session brought a brutal shock that wiped out billions of dollars in a matter of minutes. The real cause behind this massive red candle was a perfect storm in global markets that ended up hitting the crypto ecosystem hard:
The Nasdaq and AI trigger: Wall Street suffered a massive sell-off led by the semiconductor and artificial intelligence sectors. The tech giants' decline sparked panic among institutional investors, triggering an immediate flight of capital from risk assets.
Macroeconomic pressure and capital outflows: Uncertainty in traditional markets triggered a domino effect that stalled buying momentum in institutional funds, accelerating market sell-offs after key support at $80,000 was lost.
Cascade of liquidations: This combination of news triggered a massive liquidation of leveraged positions within an hour, dragging down the entire broader market.
🔍 What do the charts and the Heatmap reveal?
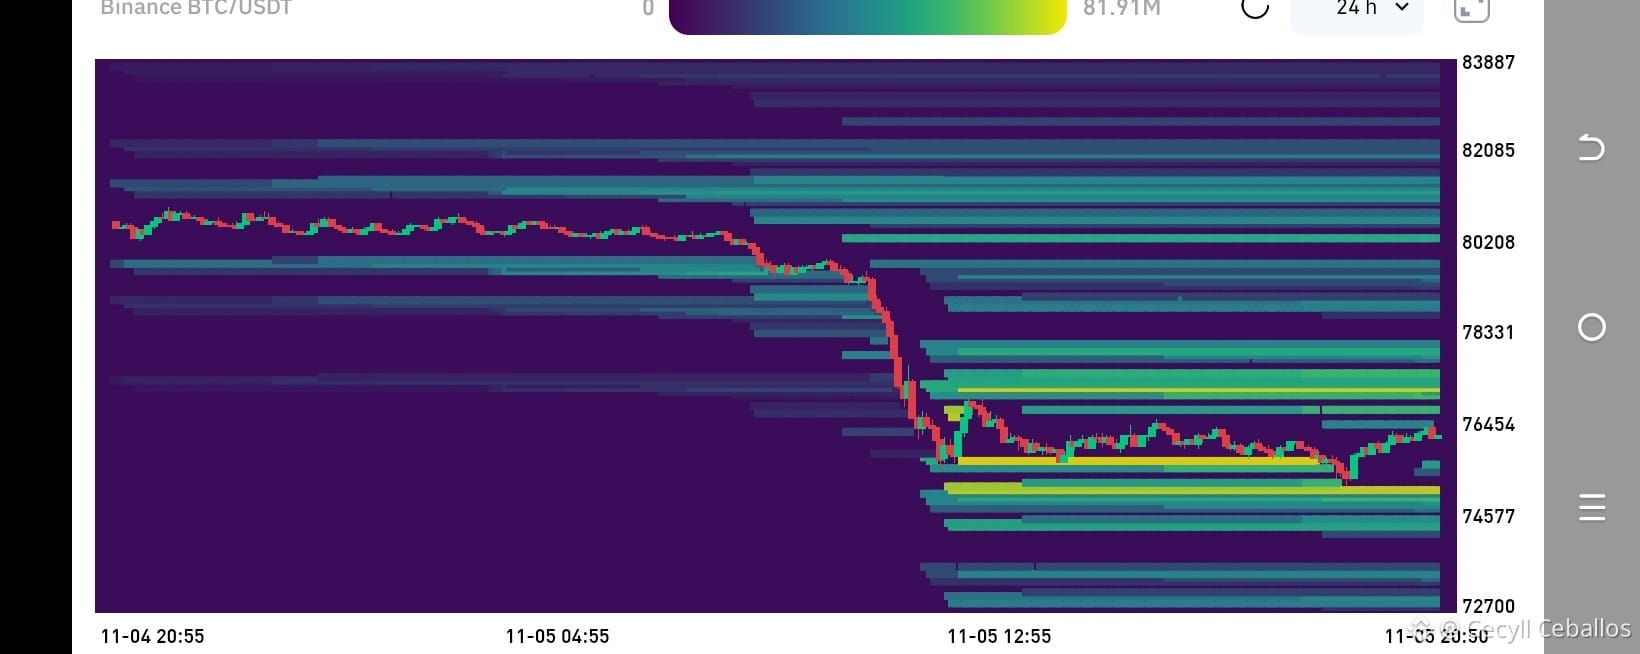
Liquidation Heatmap (24h):
After losing the area around $80,208 (with a daily high at $80,888.0), the price went into free fall, seeking lower liquidity pools.
The brightest yellow bands (with accumulations of up to 81.91M) were concentrated between $76,454 and $74,577. The move swept away virtually all traders who were Long, reaching a low of $75,158.0.
.
Technical Structure and Indicators:
Current price: Trading around $76,335.3 (-5.39%).
Moving Averages and RSI: The price broke decisively below the EMA 200 ($78,253.9) on the 30-minute chart, confirming intraday bearish dominance. Currently, the RSI(6) stands at 49.1, attempting to stabilize after touching extreme oversold levels during the plunge.
Volume Flow (CVD): The Cumulative Volume Delta shows aggressive selling in both contracts (-2.75B) and the broader market (-170.8M), reflecting the panic of the moment.
to.
Order Book Analysis:
Despite the extreme fear, open order data shows strong buying support at this level: Total Bids (Buy Orders) amount to 678.384 BTC versus Total Asks (Sell Orders) at 557.899 BTC (Ratio 0.82).
Whales are absorbing all the selling pressure near $75,000–$76,300, placing liquidity walls to stop the decline.
.
💡 Current Market Outlook
The area between $74,577 and $75,158 represents the last major liquidity block swept in the short term. If the buying absorption seen in the order book manages to hold this support, we could see a technical rebound targeting a recovery of the $77,500–$78,200 area. Conversely, if Wall Street selling pressure continues, the lower block near $74,500 will need to be watched closely.
What do you make of this market move: an entry opportunity, or would you rather wait for confirmation? Share your thoughts in the comments 👇
👍 If you like my analysis, give it a like. Follow me and I’ll follow you! 🤝🚀
$NEAR
#Bitcoin #CryptoNews #TradingAnalysis #BinanceSquare #Liquidations #BitcoinCrash #MarketUpdate #Macroeconomics #WallStreet #CryptoMarket