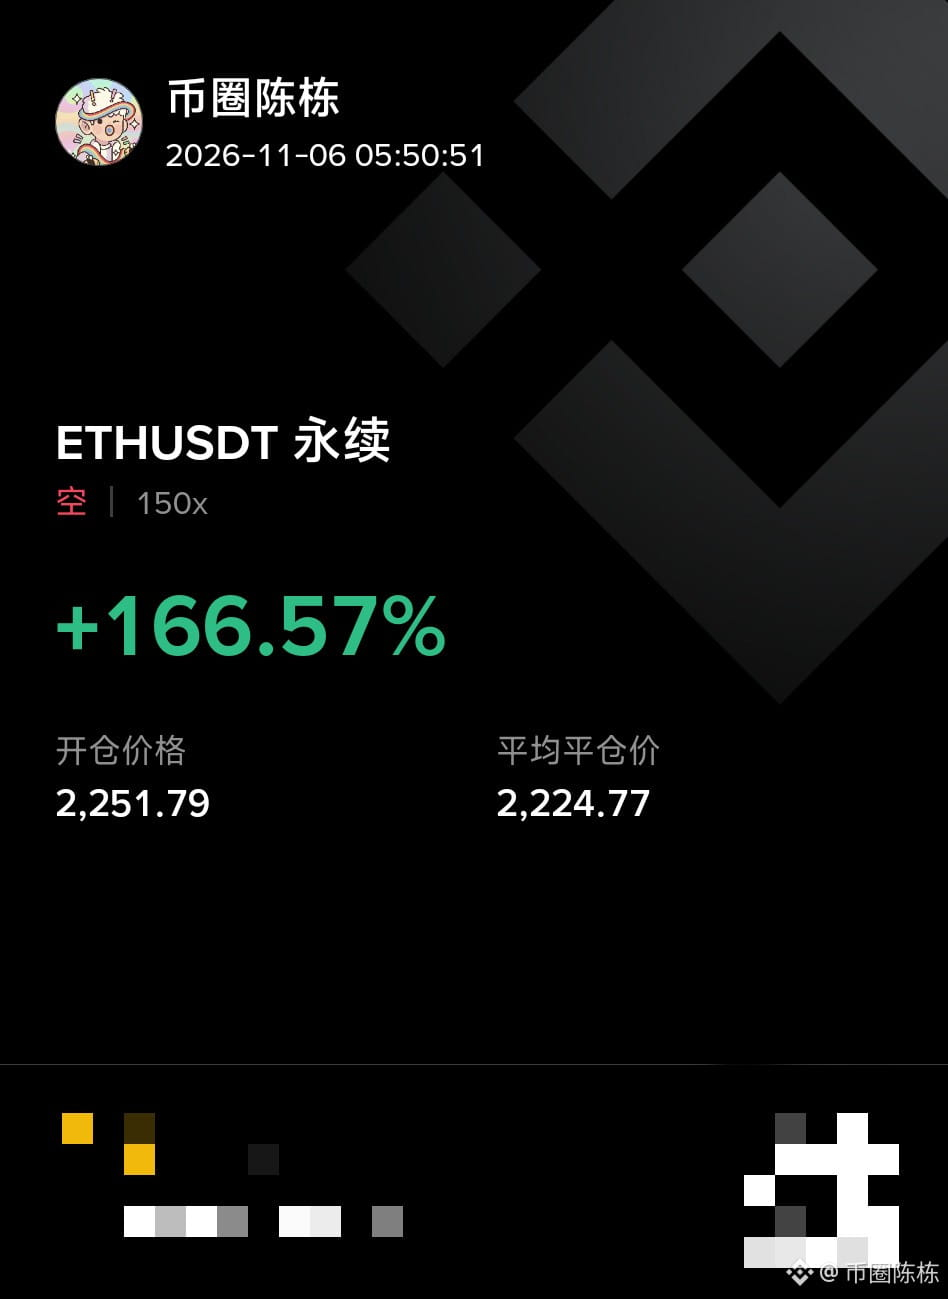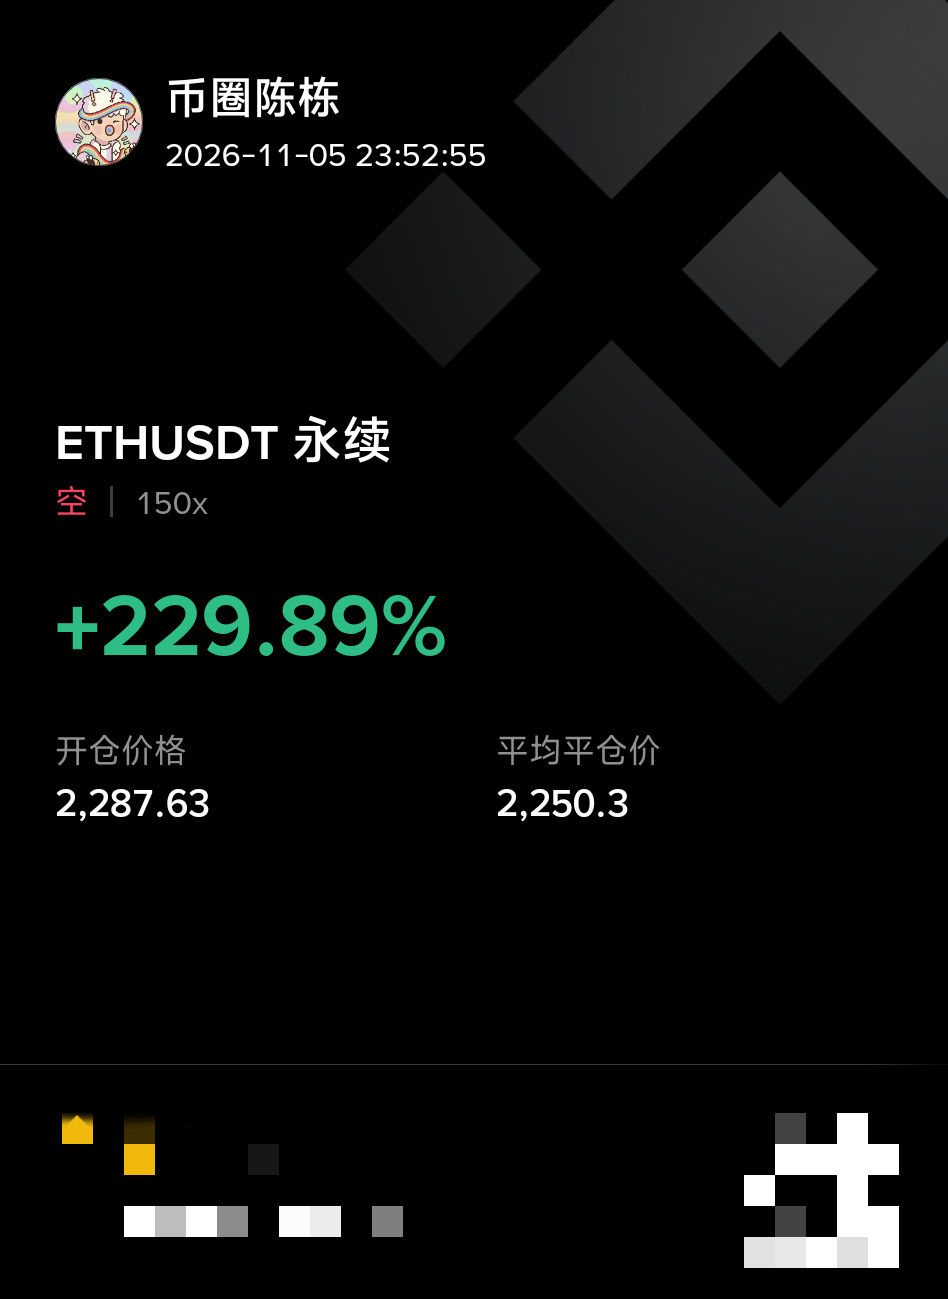
November 6 morning analysis:
On the four-hour chart, Bitcoin found a bottom and rebounded from a low of 75,525, recovering steadily to its current level of 77,650. Overall, this is a textbook recovery after a sharp downside wick. However, the short-term rebound has not changed the market’s weak structure. Price remains under pressure below the 15-period and 30-period moving averages, with resistance from the moving averages at 78,444 and 80,749 firmly capping upside. There are no signs of buyers building momentum for a breakout. The MACD shows that bearish momentum has contracted noticeably compared with earlier levels and selling pressure has eased somewhat, but both lines remain below the zero line. This indicates that the broader medium-term downtrend has not reversed; the move is merely a technical recovery within the decline. On the four-hour chart, the Bollinger Bands’ middle line at 78,117 is the key short-term battleground between bulls and bears. Whether price can hold above this level will directly determine the short-term momentum. The lower Bollinger Band at 75,023 is the key support floor for this move; a decisive break below it would trigger another deep pullback.
Short-term trading suggestions:
BTC: Long around 75,600–75,100; targets around 76,600–77,400
ETH: Long around 2,220–2,200; targets around 2,260–2,295
On the four-hour chart, Bitcoin found a bottom and rebounded from a low of 75,525, recovering steadily to its current level of 77,650. Overall, this is a textbook recovery after a sharp downside wick. However, the short-term rebound has not changed the market’s weak structure. Price remains under pressure below the 15-period and 30-period moving averages, with resistance from the moving averages at 78,444 and 80,749 firmly capping upside. There are no signs of buyers building momentum for a breakout. The MACD shows that bearish momentum has contracted noticeably compared with earlier levels and selling pressure has eased somewhat, but both lines remain below the zero line. This indicates that the broader medium-term downtrend has not reversed; the move is merely a technical recovery within the decline. On the four-hour chart, the Bollinger Bands’ middle line at 78,117 is the key short-term battleground between bulls and bears. Whether price can hold above this level will directly determine the short-term momentum. The lower Bollinger Band at 75,023 is the key support floor for this move; a decisive break below it would trigger another deep pullback.
Short-term trading suggestions:
BTC: Long around 75,600–75,100; targets around 76,600–77,400
ETH: Long around 2,220–2,200; targets around 2,260–2,295