Trading Outlook | 11/6 03:20
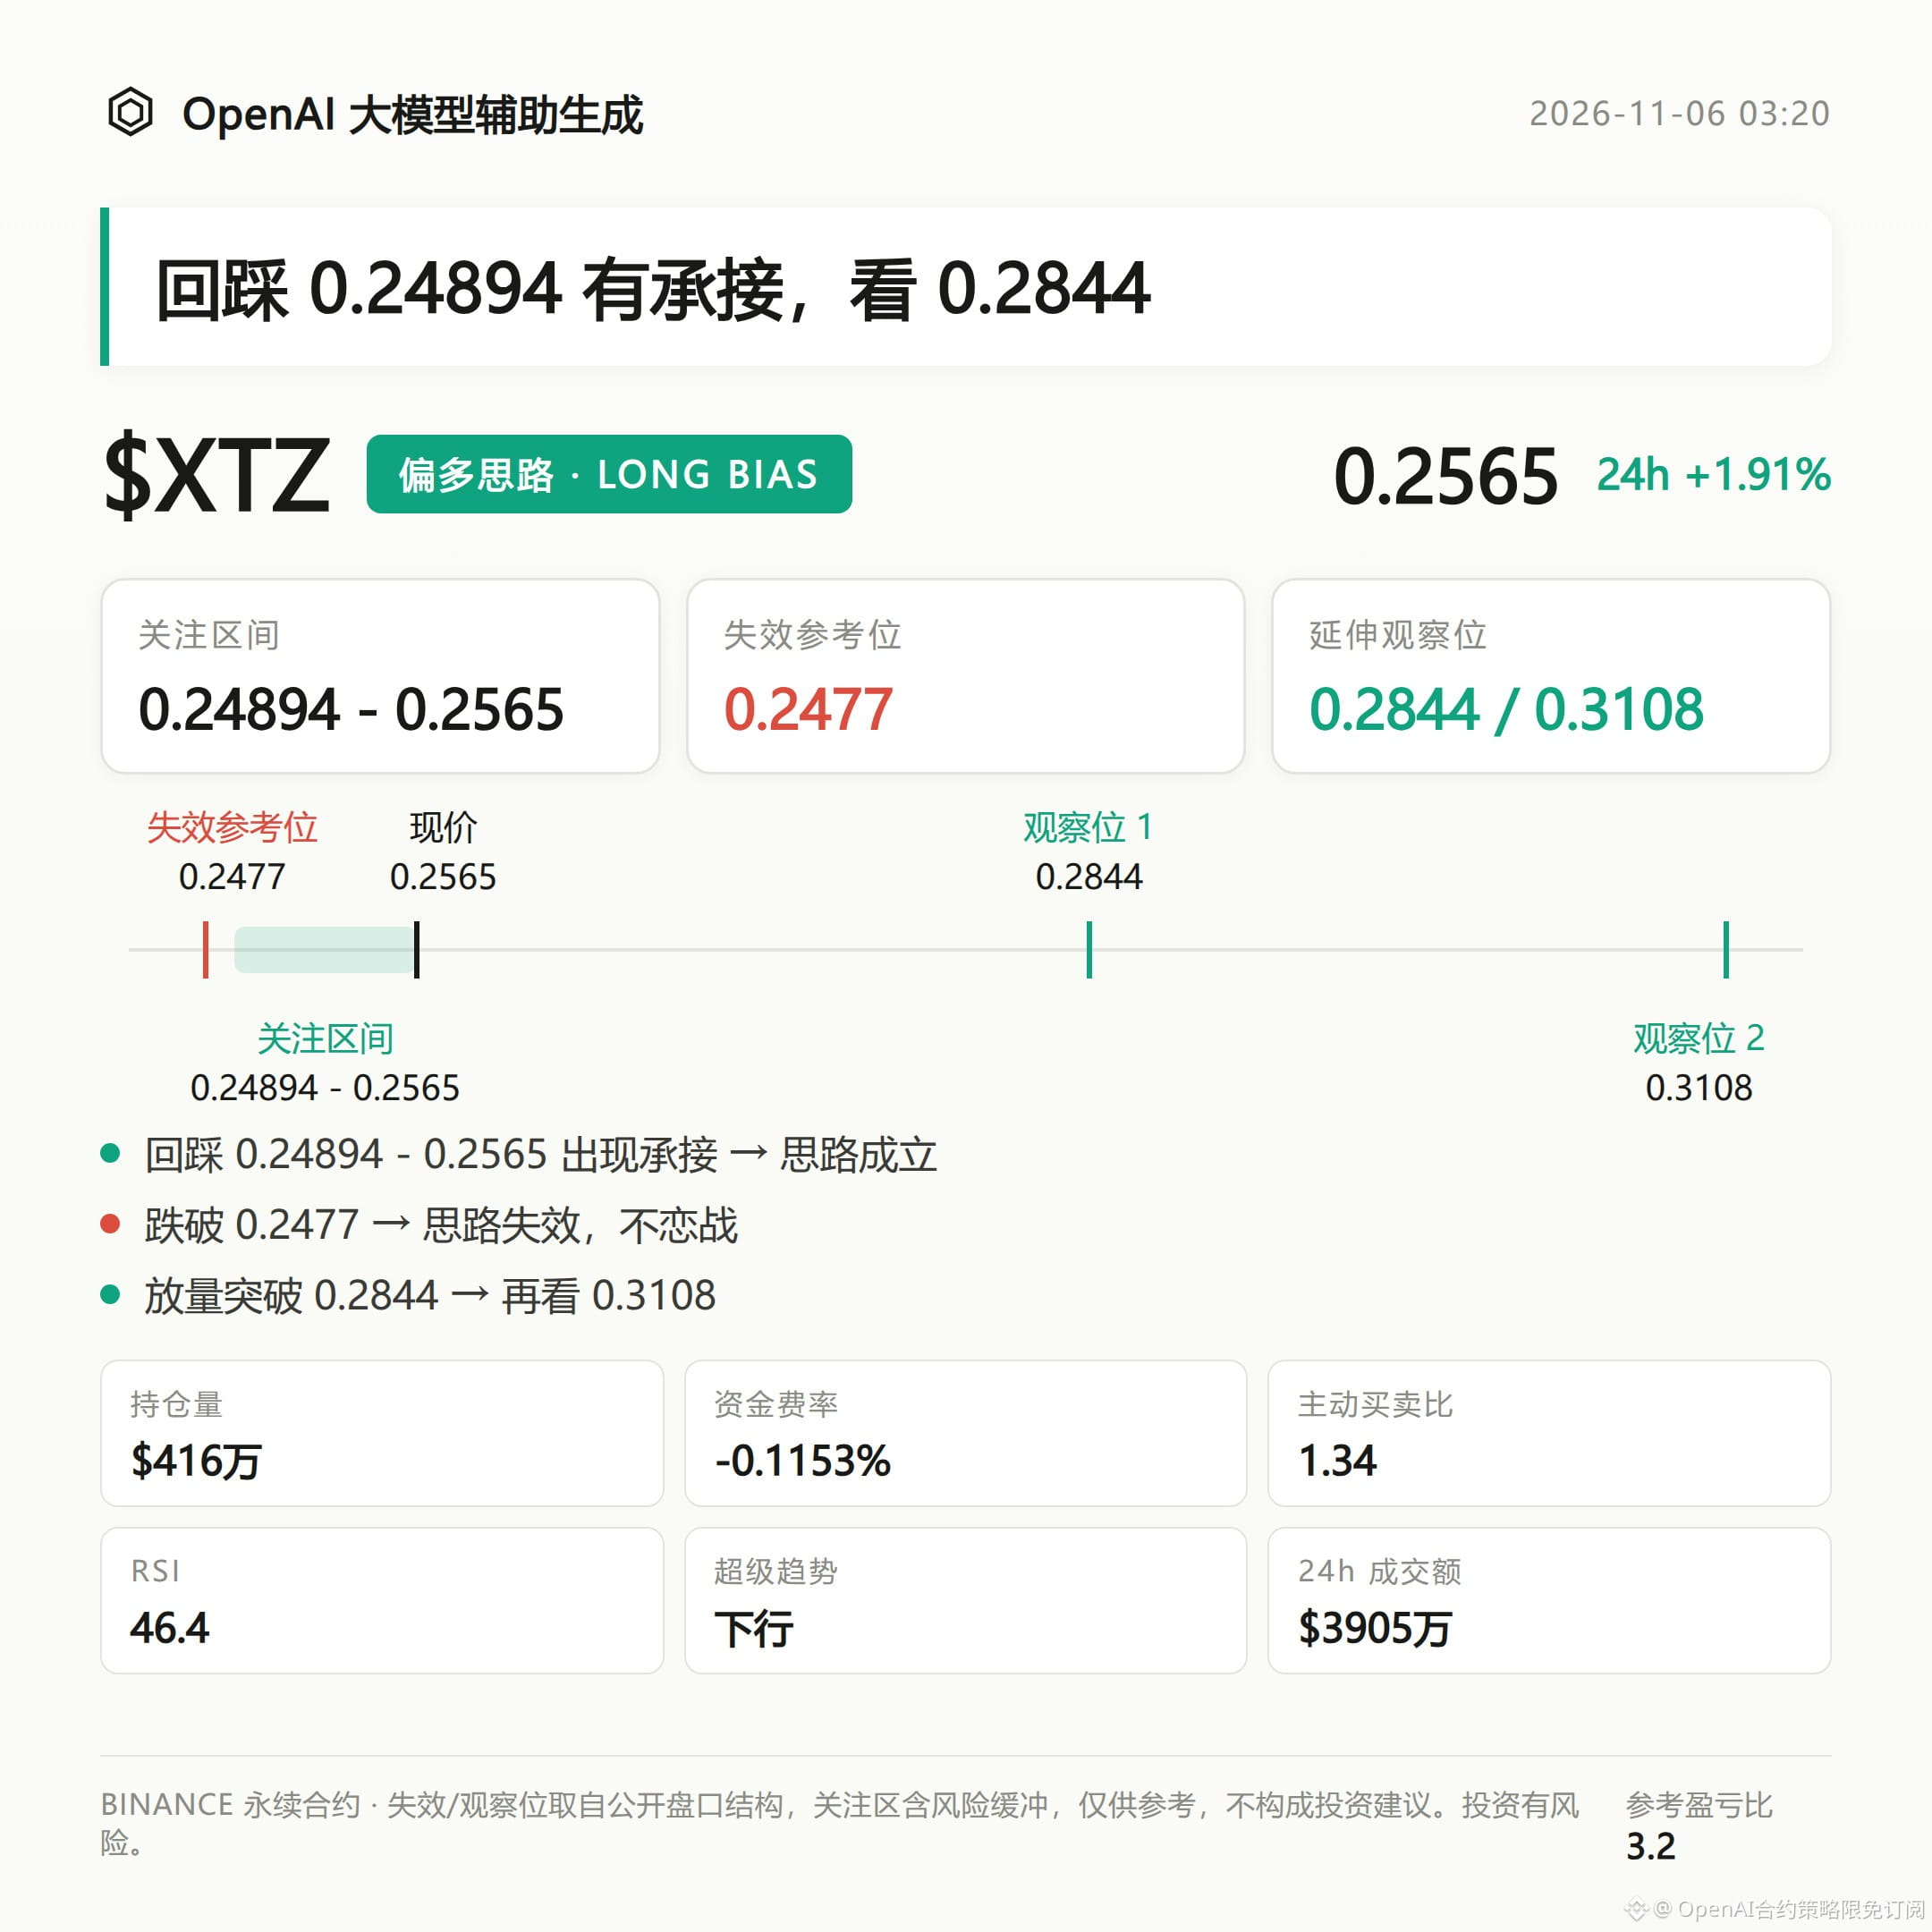
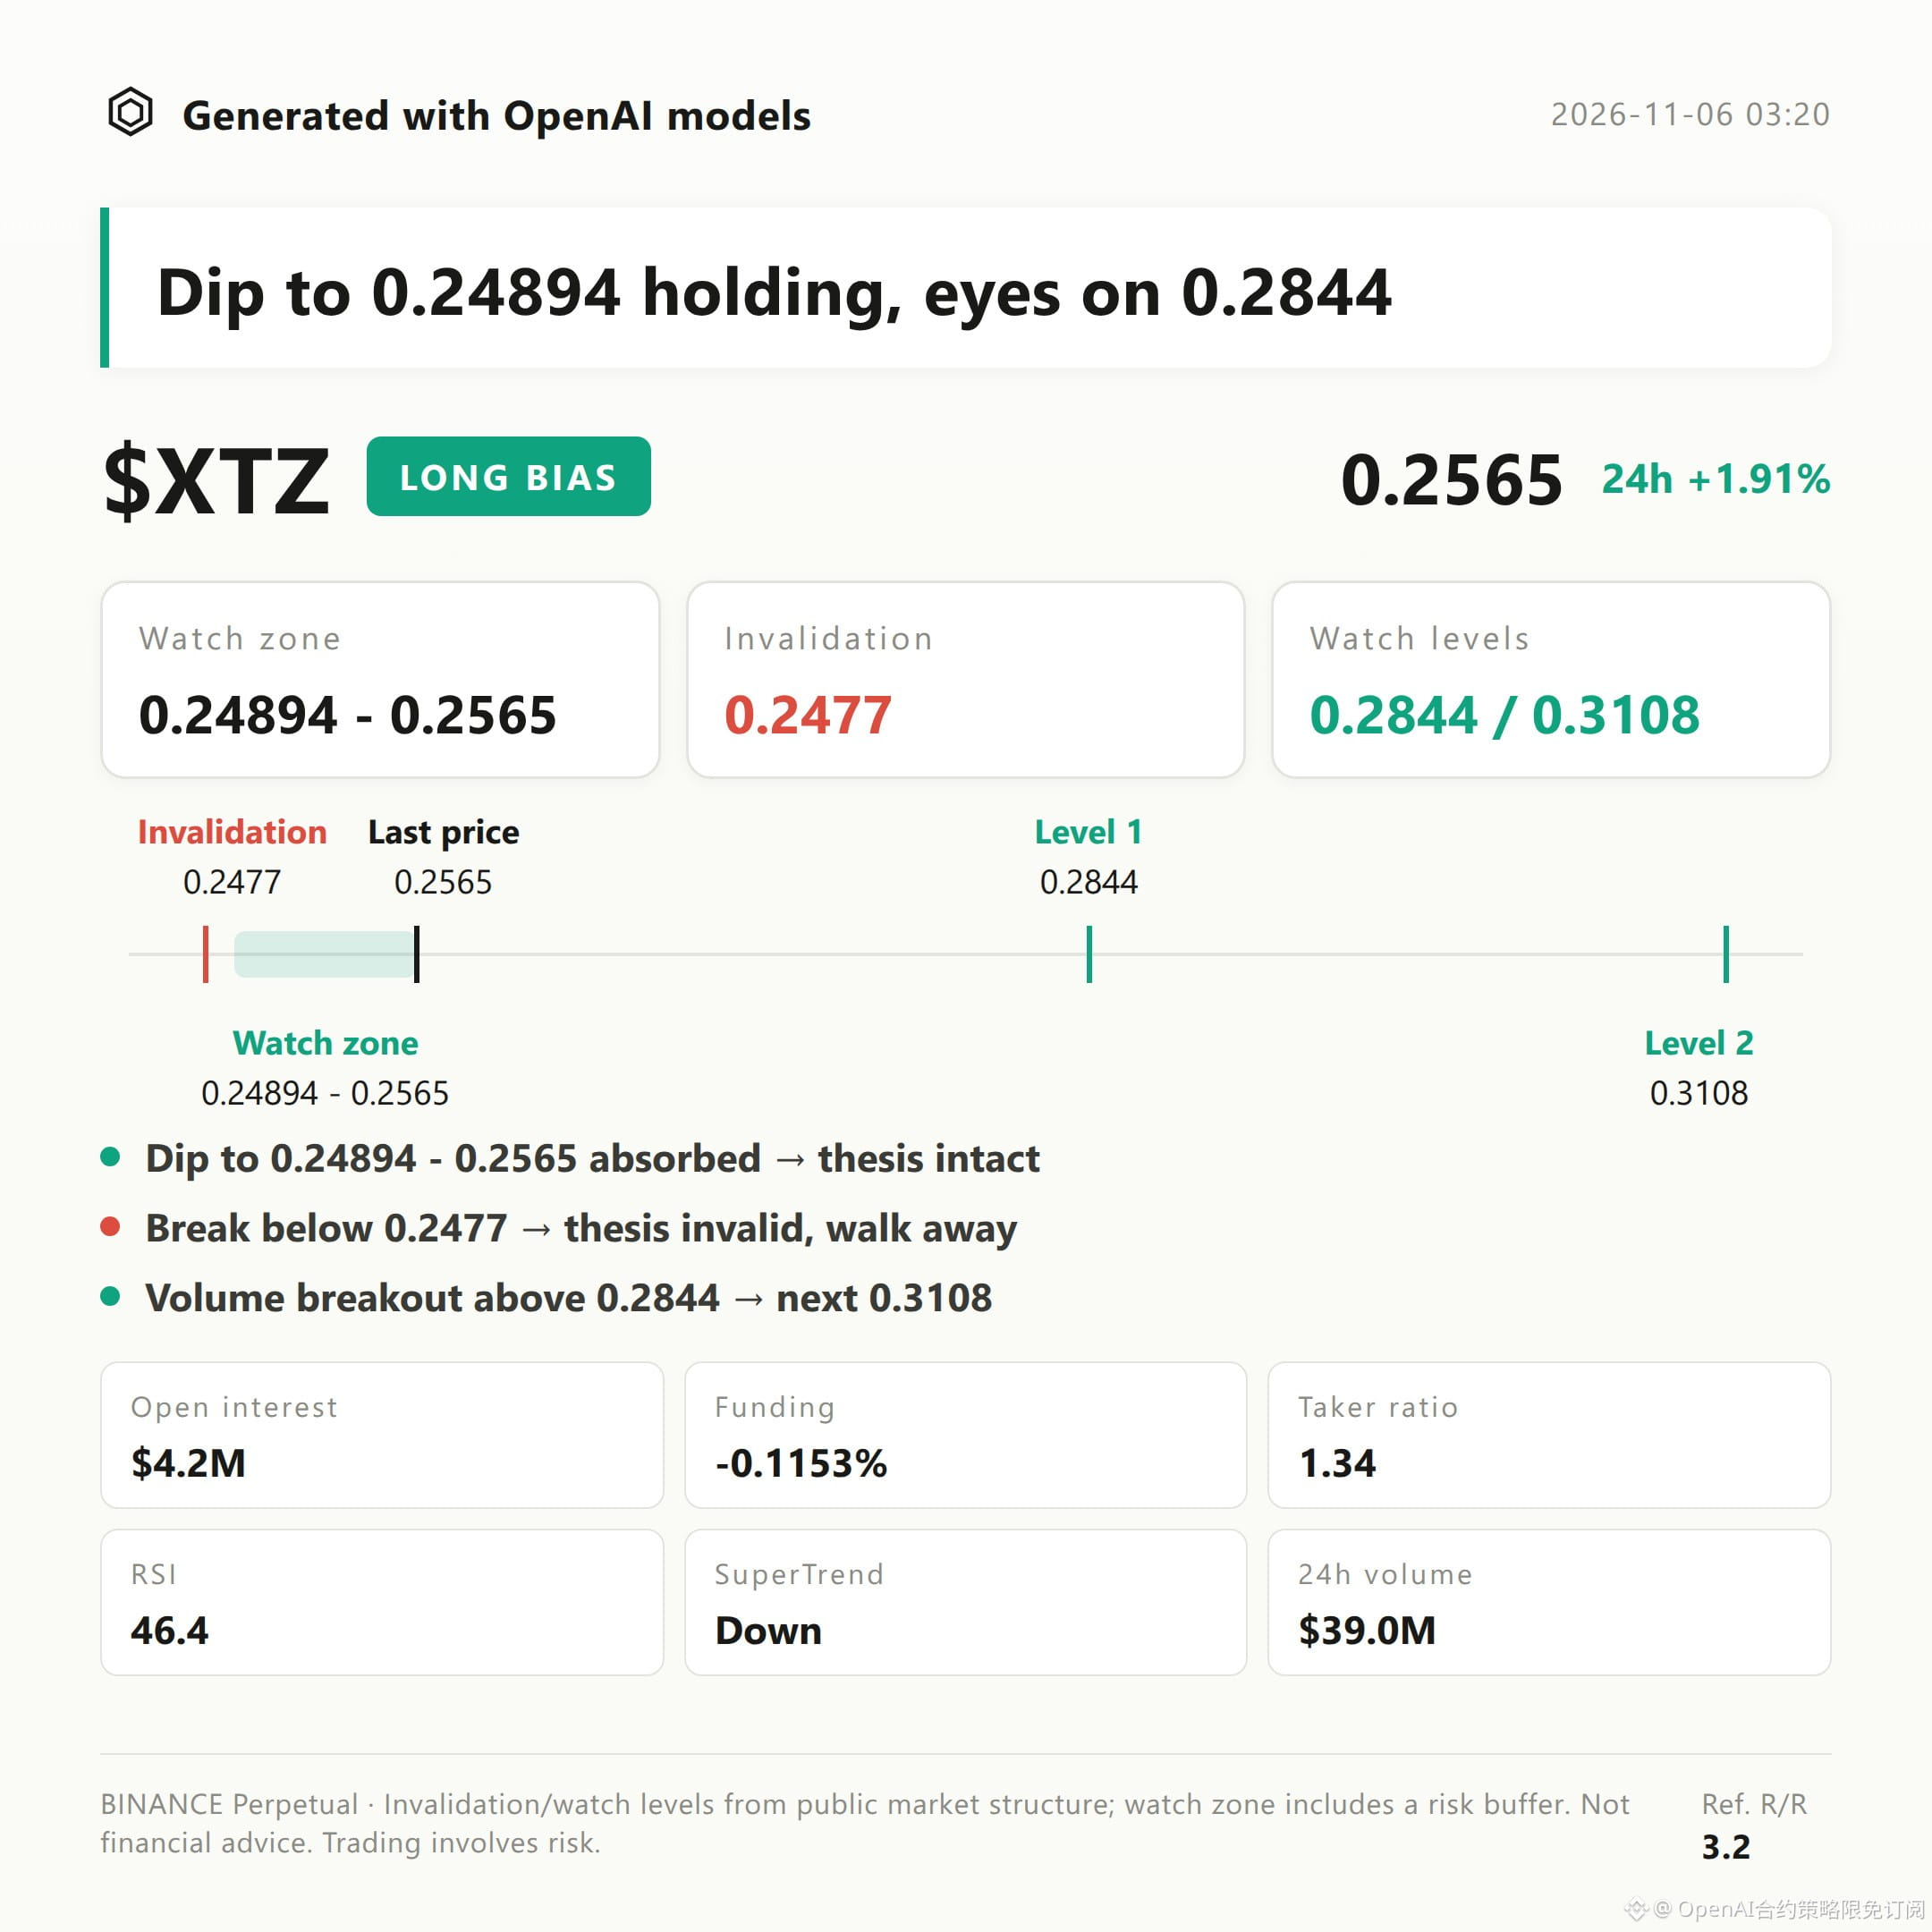
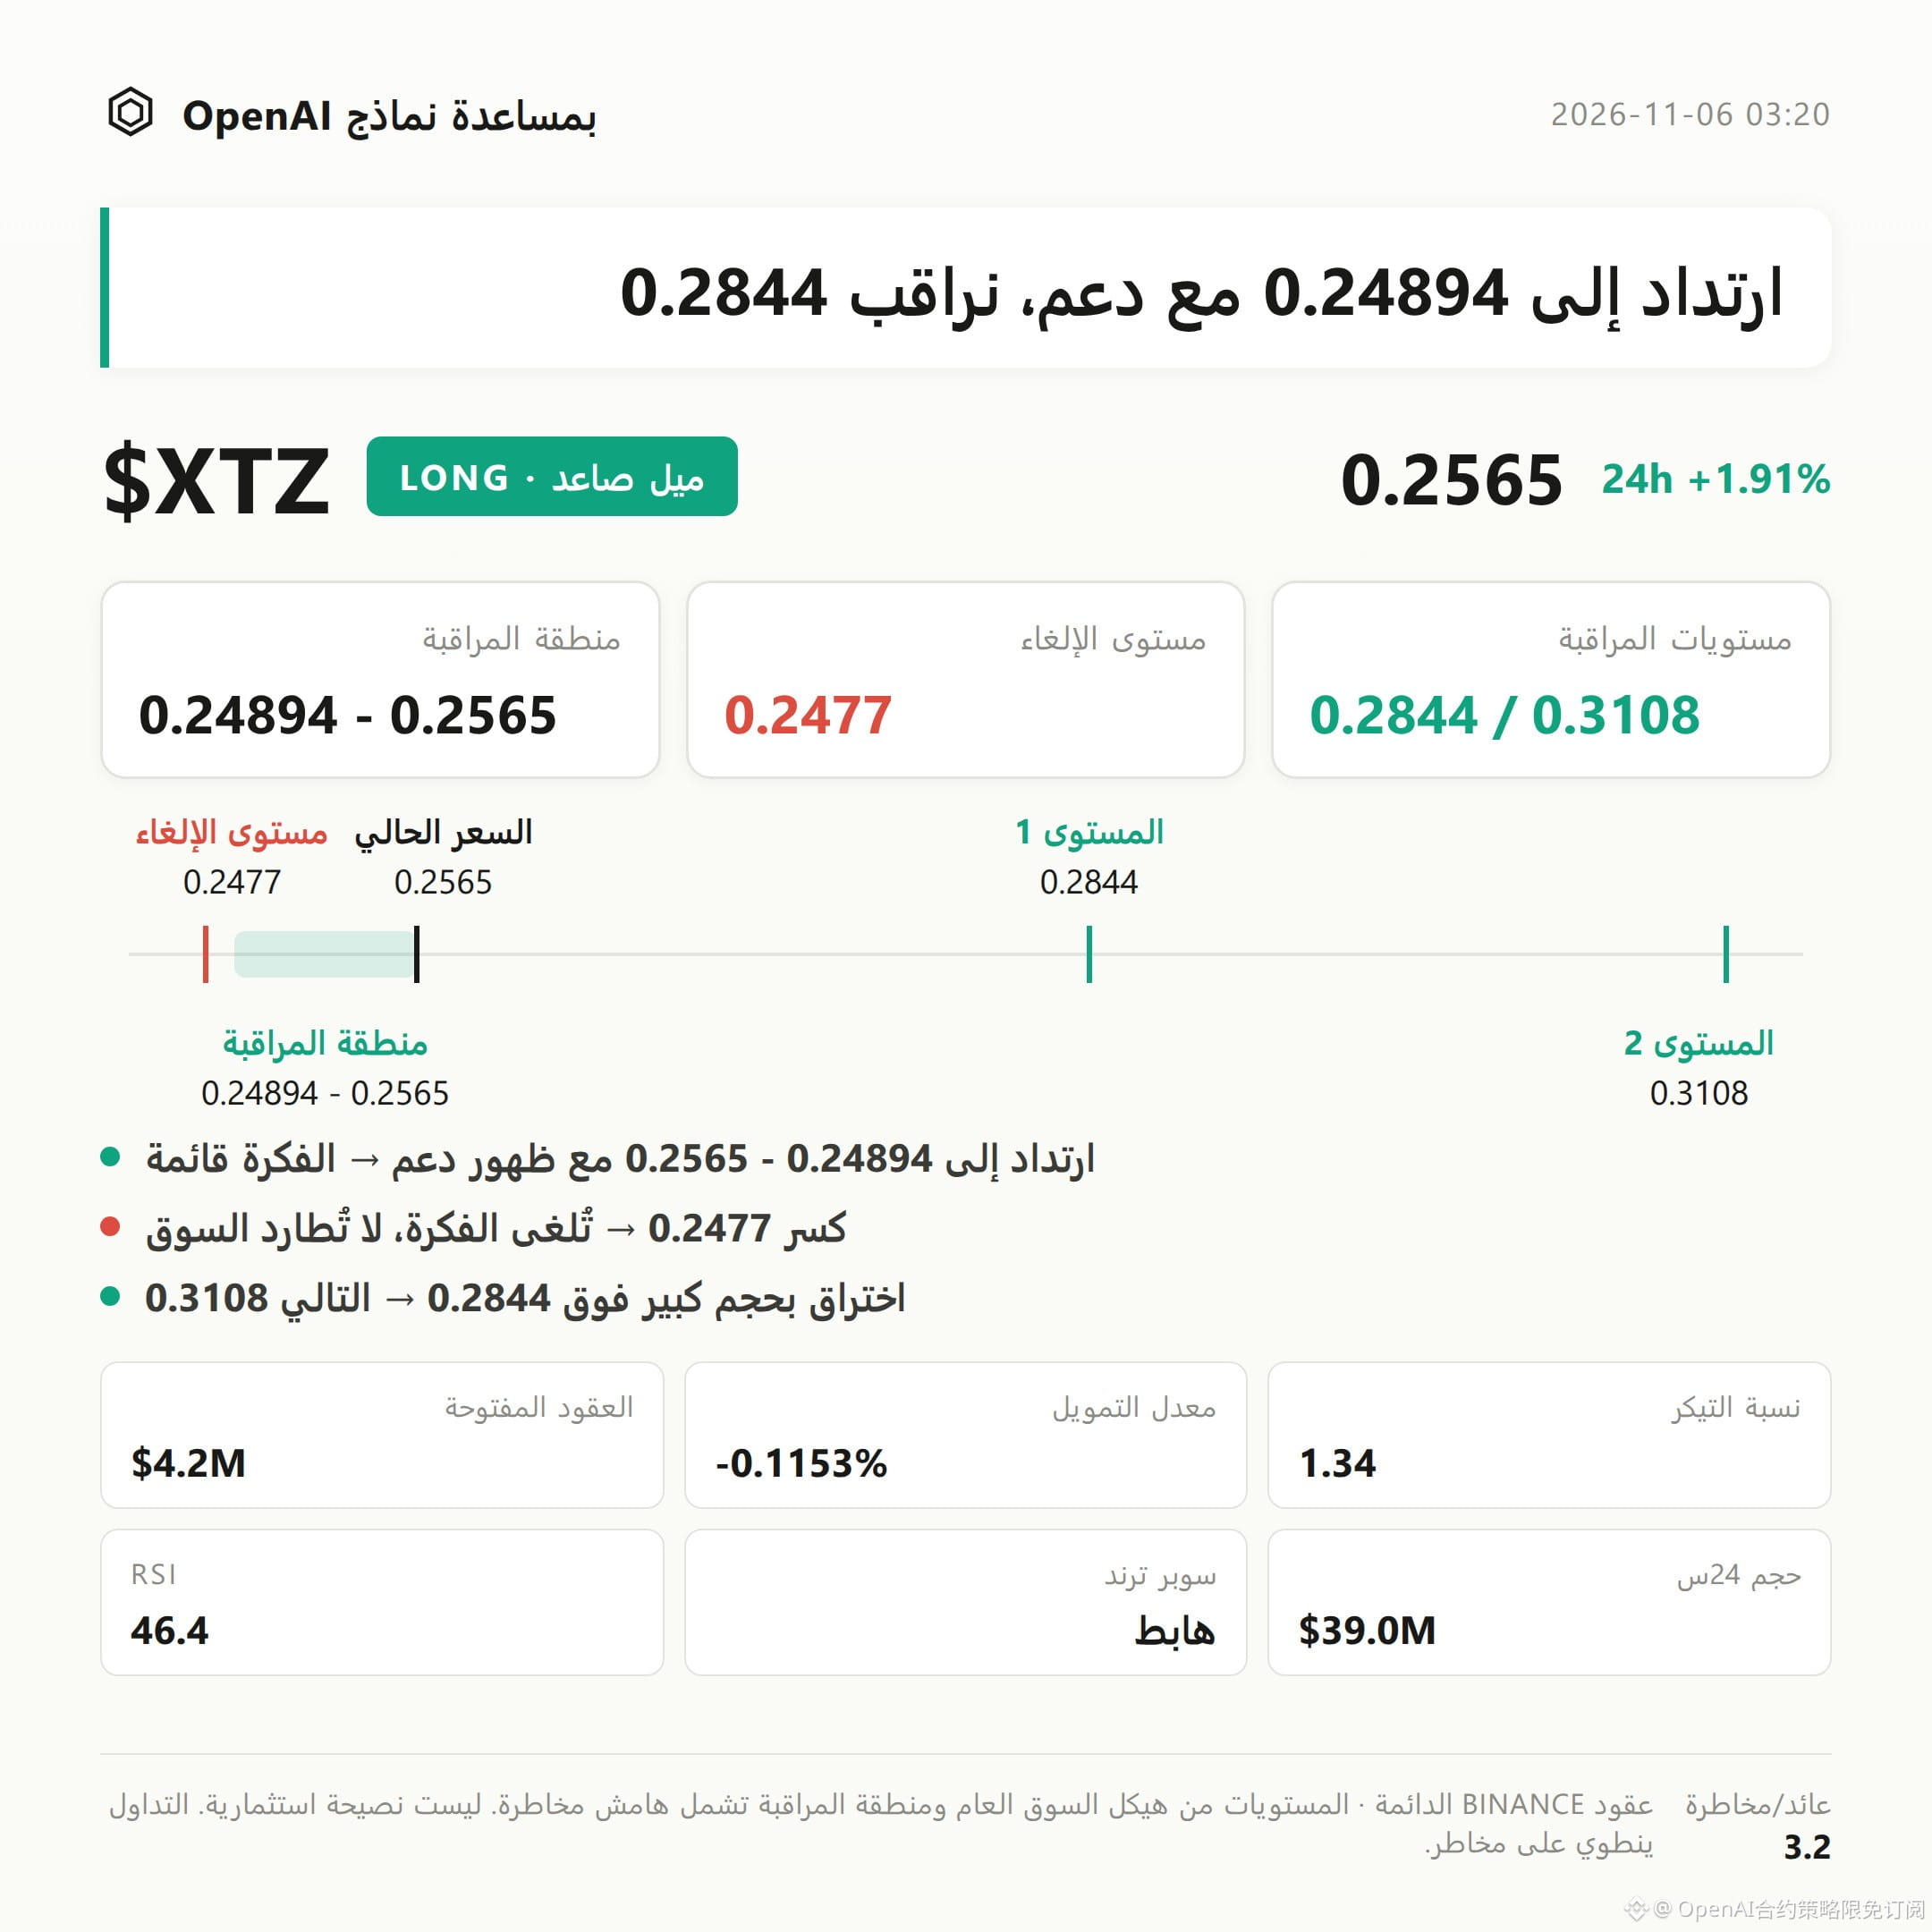
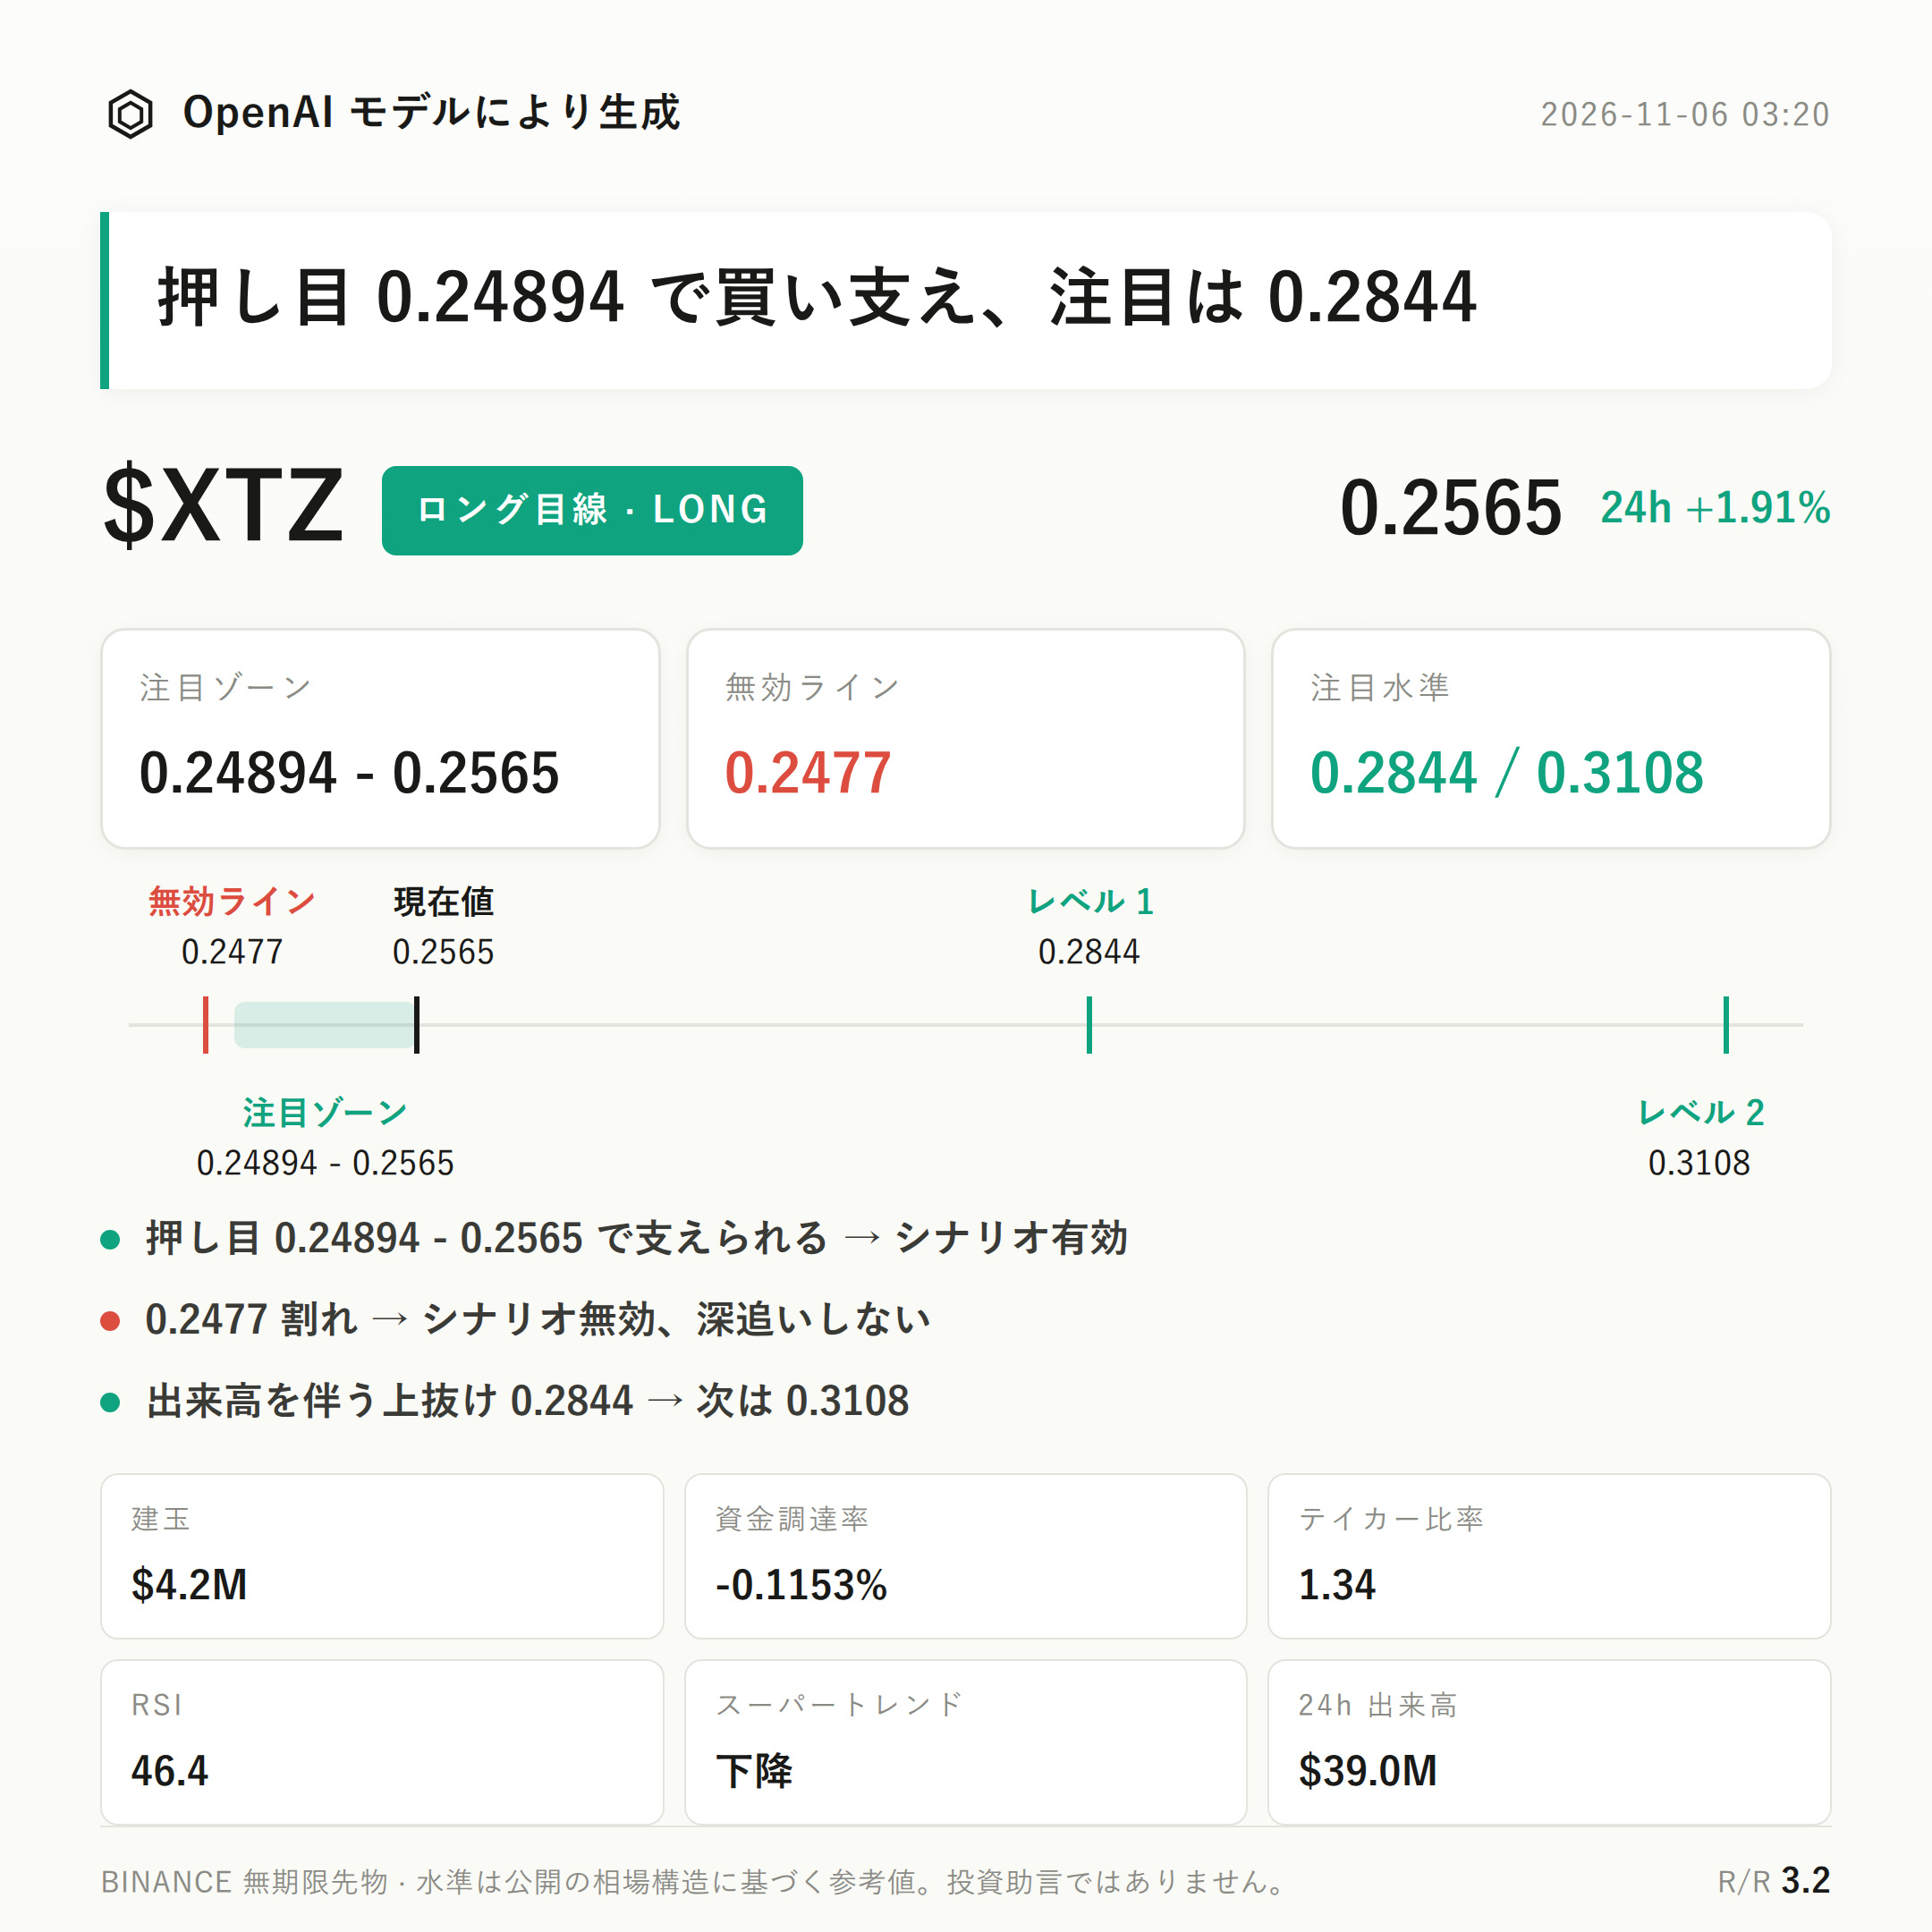
$XTZ Bullish outlook | Focus zone: 0.24894 - 0.2565 | Invalidation reference: 0.2477 | Levels to watch: 0.2844 / 0.3108
$XTZ is currently showing a bullish structure.
MACD continues to show bullish momentum, the taker buy/sell ratio is 1.34, and open interest has increased by 100.3% over 24 hours. These are the key factors supporting the current bullish outlook.
The main focus is whether the bullish reference zone can continue to hold as support.
From a technical perspective, the current price of 0.2565 is below the Bollinger middle band at 0.2656 and above the lower band at 0.2468. The RSI is 46.4, not yet in overbought territory.
Supertrend is still pointing down, indicating that the short-term recovery has not yet fully turned into a trend reversal.
The recent low of 0.2477 marks the structural boundary. To the upside, watch the Bollinger upper band at 0.2844, followed by the recent high of 0.3108.
In derivatives, the price is up 1.91% over 24 hours, trading volume is $39.05 million, and open interest has risen to $4.16 million. The increase in capital and price direction are moving in tandem.
Buyers are dominant, but the funding rate is -0.1153%, and 59% of accounts are long, indicating that disagreement between bulls and bears persists. The rapid expansion in open interest could also amplify volatility.
First, watch the bullish focus zone of 0.24894 - 0.2565; it may be preferable to wait for confirmation that the area holds after a retest.
If the area holds after a retest, the bullish outlook remains valid, with a reference risk/reward ratio of 3.2.
If the 0.2477 invalidation level is triggered, it would indicate that the current upward structure has broken down and the bullish outlook is invalidated. Do not stay in the trade.
If price breaks above 0.2844 on strong volume, then watch for resistance near 0.3108.
Regarding downside risks, there are currently no significant reversal signals. However, Supertrend remains in a downtrend, and the current price has yet to rise above the Bollinger middle band, so confirmation of the bullish outlook remains limited.
A rapid increase in open interest combined with contract leverage could lead to more pronounced volatility in both directions.
With leveraged contracts, position discipline is more important than directional predictions.
For reference only; this is not investment advice. Contracts involve leverage, and investing involves risk.
This article was generated with assistance from an OpenAI large language model.
$XTZ #Contract Analysis
$XTZ Bullish outlook | Focus zone: 0.24894 - 0.2565 | Invalidation reference: 0.2477 | Levels to watch: 0.2844 / 0.3108
$XTZ is currently showing a bullish structure.
MACD continues to show bullish momentum, the taker buy/sell ratio is 1.34, and open interest has increased by 100.3% over 24 hours. These are the key factors supporting the current bullish outlook.
The main focus is whether the bullish reference zone can continue to hold as support.
From a technical perspective, the current price of 0.2565 is below the Bollinger middle band at 0.2656 and above the lower band at 0.2468. The RSI is 46.4, not yet in overbought territory.
Supertrend is still pointing down, indicating that the short-term recovery has not yet fully turned into a trend reversal.
The recent low of 0.2477 marks the structural boundary. To the upside, watch the Bollinger upper band at 0.2844, followed by the recent high of 0.3108.
In derivatives, the price is up 1.91% over 24 hours, trading volume is $39.05 million, and open interest has risen to $4.16 million. The increase in capital and price direction are moving in tandem.
Buyers are dominant, but the funding rate is -0.1153%, and 59% of accounts are long, indicating that disagreement between bulls and bears persists. The rapid expansion in open interest could also amplify volatility.
First, watch the bullish focus zone of 0.24894 - 0.2565; it may be preferable to wait for confirmation that the area holds after a retest.
If the area holds after a retest, the bullish outlook remains valid, with a reference risk/reward ratio of 3.2.
If the 0.2477 invalidation level is triggered, it would indicate that the current upward structure has broken down and the bullish outlook is invalidated. Do not stay in the trade.
If price breaks above 0.2844 on strong volume, then watch for resistance near 0.3108.
Regarding downside risks, there are currently no significant reversal signals. However, Supertrend remains in a downtrend, and the current price has yet to rise above the Bollinger middle band, so confirmation of the bullish outlook remains limited.
A rapid increase in open interest combined with contract leverage could lead to more pronounced volatility in both directions.
With leveraged contracts, position discipline is more important than directional predictions.
For reference only; this is not investment advice. Contracts involve leverage, and investing involves risk.
This article was generated with assistance from an OpenAI large language model.
$XTZ #Contract Analysis